Infinite-Uptime

Author: Iu_Zer0

  • When the Crane Goes Down, Everything Stops

    When the Crane Goes Down, Everything Stops

    When the Crane Goes Down, Everything Stops.
    Why EOT Crane Reliability Is a Strategic Operations Problem — and How PlantOS™ Solves It

    Read Time: 8 minutes  | Author – Kalyan Meduri Why EOT Crane Reliability Is a Strategic Operations Problem — and How PlantOS™ Solves It

    Key Highlights

    • EOT crane downtime is an operations problem, not just a maintenance problem. The cascading cost — vessel delays, yard disruption, throughput loss — far exceeds the repair bill.
    • Traditional monitoring (OEM schedules + operator observation) captures failure events, not failure signals. The window for preventive action is missed.
    • Effective crane reliability requires continuous coverage across three domains: mechanical health, electrical health, and safety interlocks.
    • The PlantOS™ architecture delivers a full evidence trail — raw signal to diagnosed prescription — enabling maintenance teams to act with confidence, not just receive alerts.
    • 5-day implementation with a single-day maintenance window. Scalable from pilot to 100+ crane fleet. ROI payback in 6–12 months.
    • Prescriptive AI — not just predictive AI. The difference is execution: 99% of prescriptions acted upon, outcomes validated.

    An EOT crane doesn’t fail quietly. When an EOT crane trips unexpectedly — a brake fault, an overloaded hoist, a seized gearbox — it doesn’t just stop a lift. It stops production flow, disrupts material handling sequences, and triggers a cascade of delays that ripples through the entire operation.


    Emergency repair teams mobilise. Schedules slip. Costs start compounding immediately. In high-throughput operations, a single unplanned crane stoppage can halt production for 8–12 hours, costing anywhere from $10,000 to $50,000 per hour in lost productivity, emergency repairs, and downstream disruption.


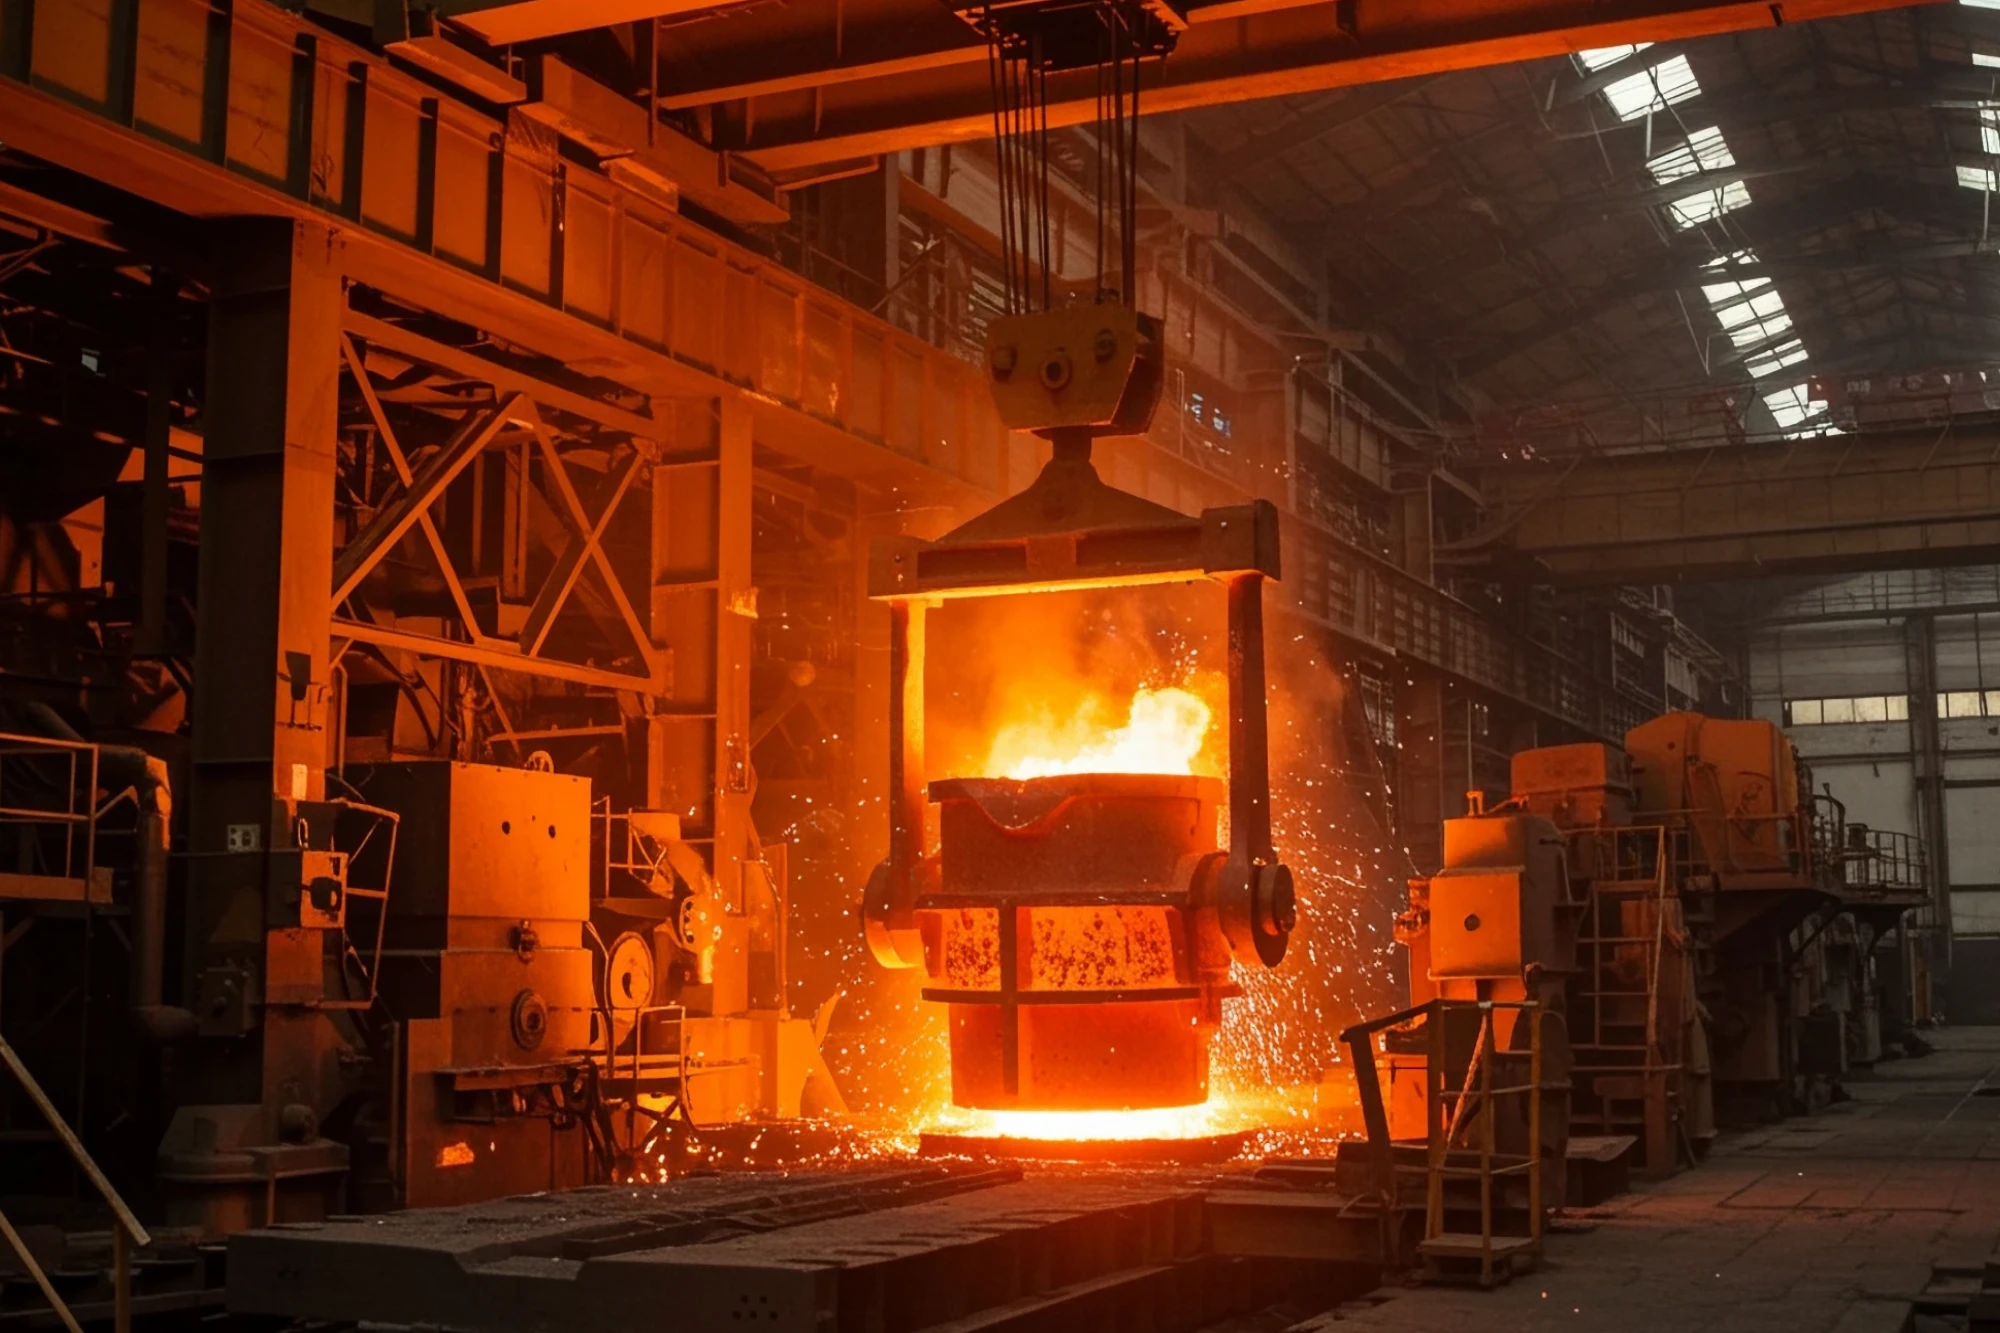
    In steel mills, a casting crane failure delays ladle movement, cascading into extended thermal hold times, sub-optimal heat scheduling, and higher kWh per ton. In cement plants, a kiln feed crane outage halts the entire pyro section downstream.


    Yet in most facilities today, crane maintenance is still driven by fixed-interval inspections and reactive response. The crane fails. The team responds. The root cause is documented — if at all — after the fact.


    This is not a maintenance problem. It is a strategic operations problem. And it has a solvable architecture.


    The cascade effect: when one crane stops, the operation stops

    Crane trip
    Brake / hoist / gearbox

    Vessel delay
    Discharge paused

    Yard disruption
    Stacking plans invalid

    Logistics backlog
    Trucking, rail delayed


    Revenue loss: $10K–$50K per hour of unplanned crane downtime


    Demurrage accrual
    $20K–$45K per day
    Emergency repair
    3–5x reactive cost
    Safety investigation
    Adjacent cranes halted

    Cross-industry impact

    Port: berth idle 8–12 hrs
    Steel: ladle cascade delay
    Cement: pyro section halt

    Figure 1: The cascade effect — when one crane stops, the entire operation stops.

    The Real Cost of Crane Downtime Is Not the Repair Bill

    Maintenance managers typically measure crane downtime in repair hours and parts cost. That calculation understates the actual business impact by an order of magnitude.

    Here’s what stops when a critical EOT crane goes offline:

    • Production flow halts. In port environments, demurrage costs begin accruing; in steel and cement, downstream processes starve for material.
    • Yard crane sequencing is disrupted. Stacking plans become invalid.
    • Downstream logistics — trucking, rail, conveyor systems — accumulate delays.
    • In steel or cement terminals, stockpile buffers deplete faster than they can be replenished, risking production stoppages.
    • Safety investigations halt adjacent cranes in the bay pending interlock verification.


    The maintenance cost is a line item. The operational impact is a multiplier. For facilities running 24/7 operations, unplanned crane stoppages represent one of the highest-impact disruption events on site — far exceeding the cost of the part that failed.

    Industry data indicates that unplanned breakdowns drive 35–50% of total crane-related operational delay. Predictive maintenance using vibration analysis has been shown to reduce downtime by 30–50% and cut maintenance costs by 10–40%. The failure modes are not mysteries — they follow identifiable progression patterns. The problem is that most facilities lack the instrumentation layer to detect them in time.

    Why Traditional
    Monitoring Falls Short

    The standard approach to crane reliability combines two layers: scheduled maintenance (OEM-recommended intervals) and operator-reported faults. Both are reactive by design.


    Scheduled maintenance creates a false sense of coverage. Intervals are set for average operating conditions — not for actual load cycles, ambient temperature variations, or the specific duty cycle of a given crane in a given bay. A crane running three shifts at 80% load will degrade its brake pads and gearbox bearings substantially faster than the maintenance schedule anticipates.


    Operator-reported faults are useful, but they capture failure events, not failure signals. By the time an operator notices abnormal noise, vibration, or erratic behaviour from a hoist mechanism, the degradation has typically been progressing for days or weeks. The window for preventive action has already closed.


    The detection gap: 3–4 weeks of missed intervention window


    Degradation

    Week 1
    Week 2
    Week 3
    Week 4
    Week 5

    Failure

    SCADA / operator sees nothing
    Operator notices


    PlantOS™ detects
    FFT signature flagged
    →
    Prescription issued
    Action + evidence trail

    3–4 week intervention window recovered

    Traditional: react after failure event
    PlantOS™: prescribe at Week 2
    Figure 2: The detection gap — 3–4 weeks of missed intervention window recovered by PlantOS™.

    Monitoring Approach Comparison

    Approach What It Captures What It Misses
    OEM Scheduled Intervals Average component life based on standard conditions Actual load cycles, environmental stress, duty variation
    Operator Observation Observable failure symptoms (noise, heat, vibration) Early-stage degradation, electrical health, interlock drift
    Post-Failure Inspection Failure mode analysis after the fact Preventing the failure — response is by definition reactive
    PlantOS™ CBM Layer Real-time mechanical, electrical & safety signals — continuous 24/7 coverage Nothing — full-spectrum instrumented monitoring

    The Three Failure Domains That Determine Crane Availability

    EOT crane failures cluster around three domains, each with distinct monitoring requirements and failure signatures.

    Mechanical Health: Hoist and Drive Train
    01

    The hoist mechanism — motor, gearbox, drum bearings, and brake assembly — is the highest-risk failure zone in any EOT crane. Vibration-based monitoring using piezoelectric sensors and FFT analysis provides the clearest early warning signal:

    • Gearbox vibration trends above ISO 10816 thresholds indicate bearing wear weeks before failure.
    • Hoist motor temperature deviation flags insulation degradation or cooling system compromise.
    • Brake pad wear percentage, captured via analog signal, predicts replacement windows accurately — eliminating both premature replacement and brake failure under load.

    Electrical Health: Contactors, Drives, and Control Systems
    02

    Electrical faults are among the most common and most misdiagnosed causes of crane downtime. Industry research indicates that up to 45% of crane failures stem from electrical faults. Drive faults, contactor failures, and control power interruptions frequently appear as ‘unknown stoppages’ in maintenance logs.

    • Master Controller position logging confirms command execution vs. actual response — flagging contactor wear before hard failure.
    • Drive healthy/fault status monitoring provides real-time visibility, enabling pre-emptive intervention.
    • Step contactor sequencing verification identifies timing drift that creates mechanical shock loads on the hoist drivetrain.

    Safety Monitoring: Interlocks, Limits, and Compliance
    03

    Safety interlock failures carry a different risk profile — regulatory, personnel, and operational simultaneously. In regulated port environments, audit-ready digital records for E-stops, limit switches, and overload trips eliminate manual log reconciliation and provide defensible evidence for insurance, certification, and incident investigations.

    • Emergency stop event logging creates an audit-ready digital trail for every E-stop activation.
    • Anti-collision interlock status monitoring prevents crane-on-crane incidents in multi-crane bays.
    • Overload trip feedback logging validates that protection systems are active under live load conditions.
    • Limit switch health status (rotary, gravity, brake liner) confirms safety boundaries are enforced in real time.


    Three failure domains that determine crane availability

    Mechanical health
    Hoist and drive train
    Gearbox vibration
    Motor temperature
    Brake pad wear %
    Drum bearing FFT
    Piezoelectric + analog

    Electrical health
    Contactors and drives
    Contactor status
    Drive fault logging
    Step sequencing
    Master controller
    Digital input (110V AC)

    Safety monitoring
    Interlocks and limits
    E-stop event log
    Anti-collision status
    Overload trip log
    Limit switch health
    Compliance + audit trail


    PlantOS™ unified view
    Single evidence trail: raw signal → trend → diagnosis → prescription

    Figure 3: Three failure domains — mechanical, electrical, and safety — unified in PlantOS™.

    The PlantOS™ Architecture: From Signal to Prescription

    PlantOS™ is built on a three-tier architecture designed for the specific constraints of crane environments — continuously moving assets with no fixed Ethernet connectivity and harsh industrial operating conditions.

    Tier 1: Signal Acquisition
    01

    On-crane instrumentation captures the full spectrum of mechanical, electrical, and safety signals:

    • Piezoelectric vibration sensors (vSense 1XT) on hoist motors and gearboxes — engineered to operate in extreme environments up to 150°C.
    • Analog input modules (4–20 mA / 0–10V) for brake wear, temperature, and drive signals.
    • Digital input modules (110V AC isolated) for all interlock and contactor feedback

    Tier 2: Edge Processing and Transmission
    02

    All IoT hardware — sensors, data logger, and control panel — is installed onboard the crane itself. A SIM-based wireless communication architecture eliminates fixed network dependency:

    • Industrial IoT Data Logger with local buffering for network failover protection.
    • PLC integration via hardwired or protocol connection.
    • Secure encrypted VPN tunnel to PlantOS™ Cloud.

    Tier 3: Cloud Analytics and Prescription Engine
    03

    Data flows into the PlantOS™ platform where it drives actionable output — not just monitoring dashboards:

    • Real-time crane dashboard with component health indexing.
    • FFT-based vibration analysis with fault frequency mapping (BPFO, BPFI, FTF, BSF).
    • Intelligent alert engine with evidence trail: raw signal → trend → diagnosis → prescription.
    • CBM maintenance planning module: condition-based work orders replace calendar-based scheduling.
    • Digital compliance tracking: automated logging of all safety events with timestamp and evidence.


    Infinite Uptime
    |
    PlantOS™ EOT Crane Safety & Reliability Blog

    PlantOS™ architecture: from signal to prescription


    Tier 3: cloud analytics and prescription engine
    Real-time dashboard
    FFT vibration analysis
    Prescription engine
    CBM work orders
    Compliance tracking
    Fleet operations center


    Encrypted VPN

    Tier 2: edge processing and transmission
    IoT data logger
    Local buffering
    PLC integration


    SIM-based wireless

    Tier 1: signal acquisition (on-crane)
    Vibration sensors
    vSense 1XT piezo
    Analog inputs
    4–20mA / 0–10V
    Digital inputs
    110V AC isolated

    Evidence trail

    Figure 4: PlantOS™ three-tier architecture — from on-crane signal acquisition to cloud prescription engine.

    The evidence trail is the critical differentiator. A PlantOS™ prescription doesn’t say ‘check gearbox.’ It delivers: “Gearbox vibration at MDE bearing trending 23% above baseline over 14 days. BPFO frequency signature indicates outer race wear. Recommend bearing inspection within 7 days. Evidence: trend chart, FFT spectrum attached.”

    This is what a 99% prescription adoption rate looks like in practice. Maintenance teams act on prescriptions because the evidence justifies the action — and because the prescription specifies what to do, not just that something is wrong.

    Expected Business Impact: From Reactive to
    Prescriptive Reliability

    Outcome Domain Current State (Reactive) Target State (PlantOS™) Expected Improvement
    Unplanned Breakdowns Failure-triggered response Pre-emptive repairs from early alerts 35–50% reduction per quarter
    MTBF OEM intervals, not condition-driven Condition-based — intervene on signal, not schedule +25% MTBF improvement
    Emergency Repairs High frequency, high cost Planned interventions replace emergency response Significant reduction in emergency labour cost
    Fault Detection to Response Hours to days (operator observation) Minutes (real-time alert + evidence trail) Response time reduced by >80%
    Safety Compliance Manual logs, periodic inspections Continuous digital logging, audit-ready 100% interlock compliance visibility

    Beyond single-crane metrics, the PlantOS™ architecture scales to fleet-level visibility. The Fleet Operations Center view supports centralised monitoring of 100+ cranes with health heatmaps, bay-wise benchmarking, and unified alert management.

    Implementation: 5 Days to Live Monitoring

    Deployment follows a structured five-day implementation plan, with a single-day downtime requirement limited to sensor installation and PLC handshake:

    • Day 1: Hardware mounting, sensor installation, data logger setup, PLC handshake, network connectivity verification.
    • Day 2–3: Dashboard configuration, signal validation, baseline calibration, test data verification.
    • Day 4–5: Go-live — final validation, user training, system handover to operations. 2–3 week equipment contextualisation period for AI model calibration.

    Start with a pilot crane in the highest-criticality bay. Validate the value. Then scale across the fleet. The modular architecture means organisations do not need to commit to full fleet deployment upfront. ROI payback: 6–12 months against an industry norm of 18–24.

    The Prescriptive Difference: Why Prediction Alone Is Not Enough

    The industrial AI market has spent a decade on prediction. Dozens of platforms now offer vibration anomaly detection and failure probability scores. The industry’s response has been measured — MIT Sloan Management Review India and Infinite Uptime’s joint research found that 44% of industrial practitioners remain neutral, waiting for plant-specific proof before committing trust.

    The bottleneck is not prediction accuracy. It is execution. A platform that identifies a gearbox fault at 70% confidence, with no context about what to do next, creates alert fatigue — not reliability improvement.

    PlantOS™ is built around the 99% Trust Loop™ — a validated cycle where every prescription is acted upon because it is specific, evidence-backed, and contextually grounded:

    • 99.97% prediction accuracy (customer-validated across 85,000+ monitoring locations)
    • Up to 99% prescription adoption rate
    • 100% user-validated outcomes
    • 2–3 week equipment contextualisation from deployment
    • 140,641+ hours of unplanned downtime eliminated across 881 plants globally
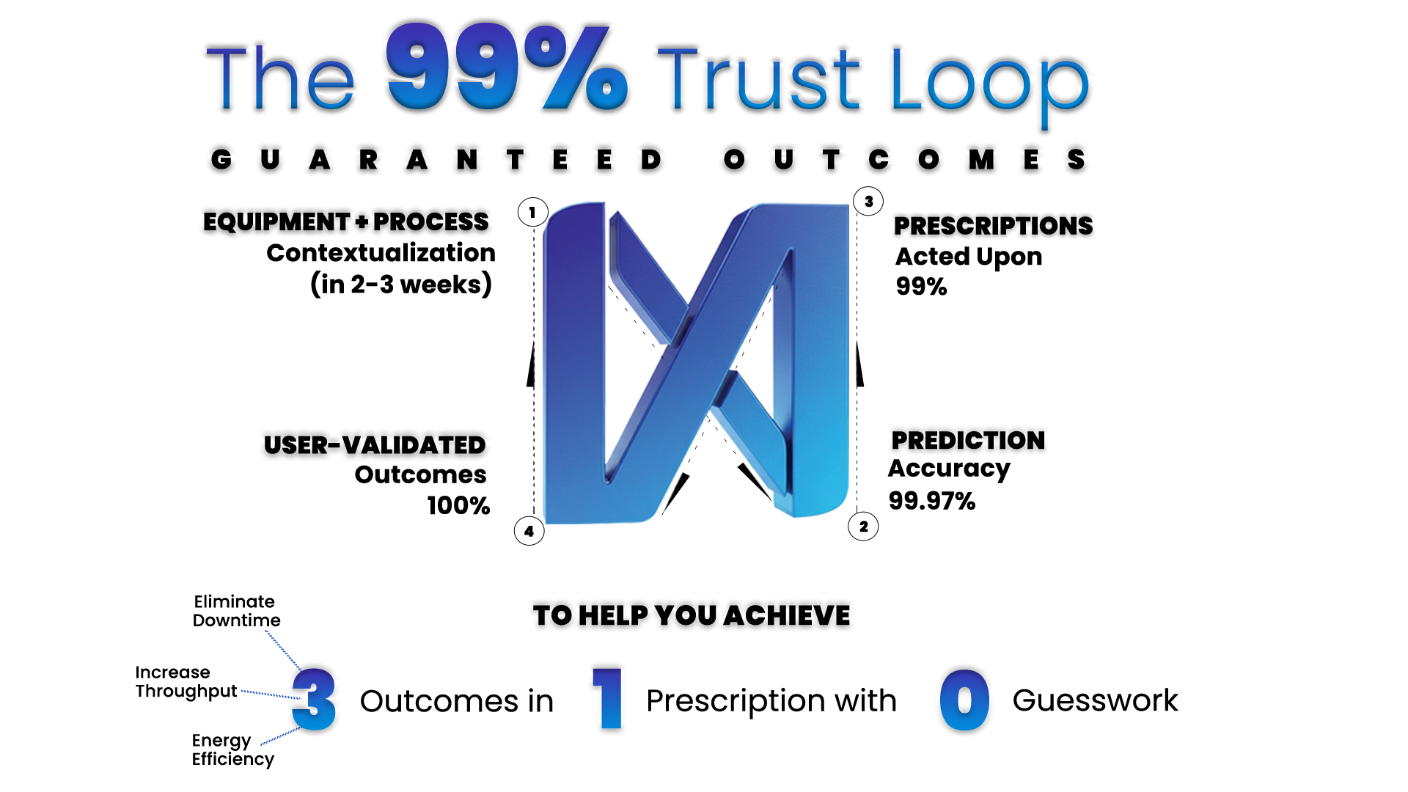
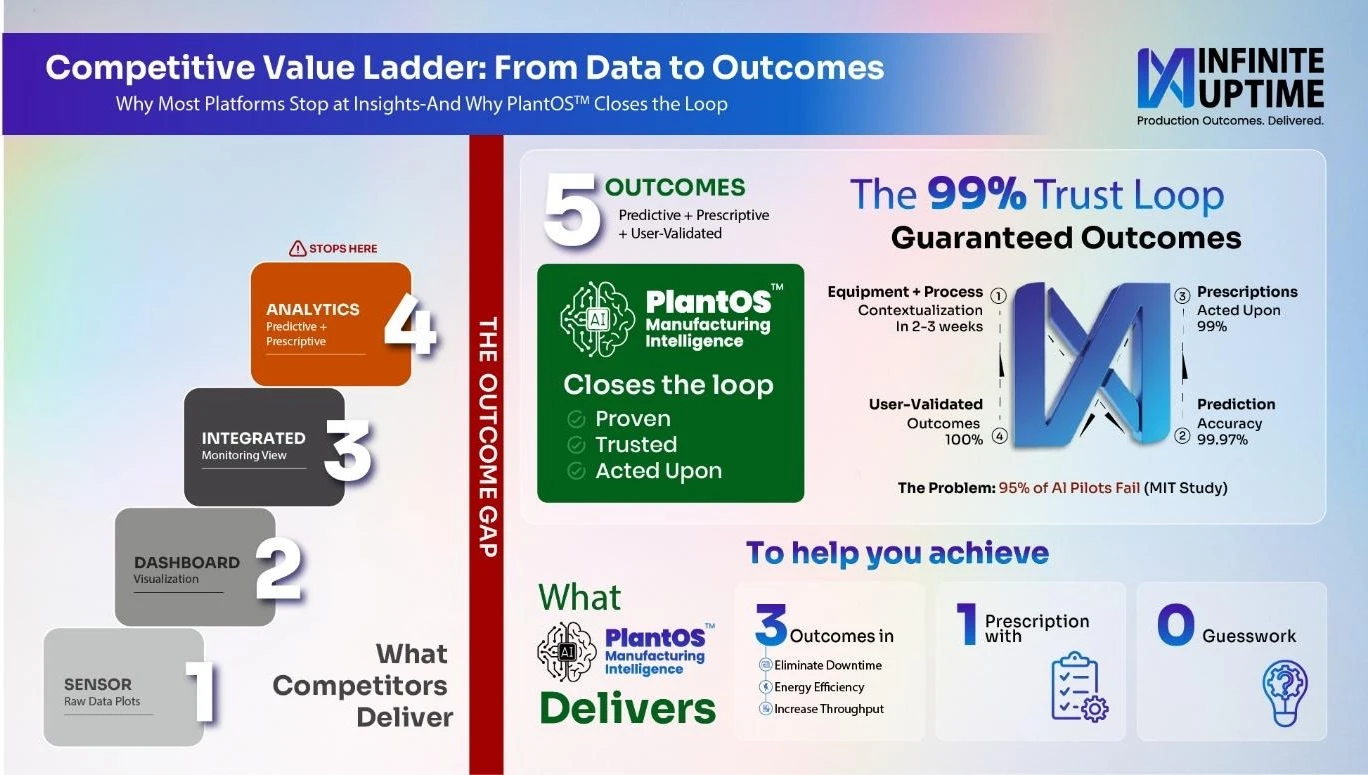
    Infographic titled "The 99% Trust Loop: Guaranteed Outcomes." A central blue 3D "N" icon is surrounded by a four-step cycle: 1. Equipment + Process Contextualization, 2. 99.97% Prediction Accuracy, 3. 99% Prescriptions Acted Upon, and 4. 100% User-Validated Outcomes.

    The outcome is not a monitoring system. It is a reliability intelligence platform that transitions crane operations from reactive maintenance to semi-autonomous production management — where human judgment is supported, not replaced, by AI prescriptions backed by machine-verified evidence.

    Frequently Asked Questions


    1. What is the difference between predictive and Prescriptive AI for EOT cranes?

    Predictive maintenance tells you that a crane component is likely to fail. Prescriptive AI goes further — it tells you exactly what is failing, why, what action to take, and provides the evidence (vibration spectra, trend data, fault frequency analysis) to justify the intervention. PlantOS™ delivers prescriptive intelligence with a 99% prescription adoption rate, and 99.97% Prediction Accuracy, meaning maintenance teams act on virtually every recommendation because the evidence is specific and actionable. This is the core difference between a system that generates alerts and one that drives outcomes.


    2. How does PlantOS™ monitor EOT cranes that are continuously moving and have no fixed network connection?

    PlantOS™ uses a SIM-based wireless communication architecture that eliminates the need for fixed Ethernet or Wi-Fi connectivity. All IoT hardware — including piezoelectric vibration sensors, analog and digital input modules, and the industrial data logger — is installed onboard the crane itself. The data logger includes local buffering for network failover protection, ensuring no data loss even during connectivity interruptions. Data is transmitted via a secure encrypted VPN tunnel to the PlantOS™ Cloud for real-time analysis.


    3. What types of EOT crane failures can PlantOS™ detect, and how early can it identify them?

    PlantOS™ monitors three failure domains: mechanical health (hoist motor vibration, gearbox bearing wear, brake pad degradation), electrical health (contactor wear, drive faults, control power interruptions, step contactor sequencing drift), and safety interlocks (E-stop events, anti-collision systems, overload trip feedback, limit switch health). Vibration analysis using FFT fault frequency mapping can identify bearing and gearbox degradation 2–6 weeks before catastrophic failure, giving maintenance teams a substantial planning window for intervention during scheduled downtime.


    4. How long does it take to deploy PlantOS™ on an EOT crane, and what is the expected ROI timeline?

    Deployment follows a structured 5-day implementation plan with only a single day of crane downtime required for sensor installation and PLC handshake. Days 2–3 cover dashboard configuration and signal validation, and Days 4–5 complete go-live validation, user training, and system handover. The AI model calibrates over a 2–3 week contextualisation period post-deployment. ROI payback is typically achieved within 6–12 months, compared to the industry norm of 18–24 months, driven by reduced unplanned downtime, lower emergency repair costs, and improved safety compliance.


    5. Can PlantOS™ scale from a single crane pilot to an entire multi-site crane fleet?

    Yes. PlantOS™ is designed for modular, incremental deployment. Most organisations begin with a pilot crane in their highest-criticality bay to validate the value proposition. Infinite Uptime currently operates across 881 plants globally with the largest install base in the steel industry at over 84 MTPA of production capacity monitored. The same architecture that monitors casting cranes in steel mills and kiln feed cranes in cement plants applies to port, mining, and manufacturing EOT crane fleets.

    Read More Blogs

  • Energy Efficiency, Innovation & Process Reliability:

    Energy Efficiency, Innovation & Process Reliability:

    Energy Efficiency, Innovation & Process Reliability:
    The Unseen Trio Driving Cement’s Net Zero Journey in Europe

    Read Time: 8–9 minutes | Author – Kalyan Meduri

    Energy Efficiency, Innovation & Process Reliability: The Unseen Trio Driving Cement’s Net Zero Journey in Europe

    Net Zero Is Not a Cost — It’s a Multiplier


    The European cement industry sits at the heart of one of heavy industry’s most complex decarbonisation challenges. Responsible for approximately 7% of global CO₂ emissions (UNECE/IEA), cement production is both energy-intensive and process-dependent. Yet leading producers — Holcim and Heidelberg Materials foremost among them — are demonstrating that Net Zero transformation can coexist with profitability, driven by three reinforcing pillars: energy efficiency, sustainability innovation, and process reliability.


    However, a critical question remains: can the industry close the gap between digital insight and plant-floor execution? Research conducted by MIT Sloan Management Review India in collaboration with Infinite Uptime — surveying 48 senior industrial leaders across six countries — reveals that 81% of maintenance professionals rate current systems as only moderately effective at converting AI insights into action. This “execution gap” is not a technology problem alone. It is a trust problem, a context problem, and ultimately, a production-outcomes problem.

    Energy Efficiency as a Profit Engine

    Energy accounts for up to 30–40% of cement production costs, making efficiency a direct lever for profitability. European leaders have aggressively optimised thermal and electrical consumption through waste heat recovery systems, advanced kiln optimisation, and electrification paired with renewable power sourcing.


    According to the IEA/OECD Technology Roadmap, improving energy efficiency is one of the primary carbon mitigation levers in the cement sector. EU best-in-class thermal efficiency targets are converging toward 3.16 GJ/ton clinker, demonstrating incremental gains through process optimisation.


    Holcim, for instance, integrates energy-efficient building solutions and low-carbon cement products while aligning with Science Based Targets Initiative (SBTi)-validated net-zero pathways. The financial logic is clear:

    Energy Lever Mechanism Financial Impact
    Lower fuel consumption WHRS, kiln optimisation Reduced operating cost
    Reduced carbon intensity Alternative fuels, clinker substitution Lower EU ETS carbon tax exposure
    Electricity optimisation Renewable sourcing, load balancing Improved EBITDA margins

    MIT SMR India Research Insight: The MIT Sloan Management Review India study finds that 50% of respondents report asset, process, and energy data are not linked in their current systems. Without this integration, energy optimisation remains siloed — divorced from the process context and maintenance realities that determine whether efficiency gains are sustained or eroded by unplanned downtime.

    Sustainable Innovation Driving Revenue Growth

    European cement majors are not just cutting emissions — they are monetising sustainability through premium green products and breakthrough carbon capture technology.

    Heidelberg Materials: The Cement Plant
    That Created a New Market01

    At Norway’s coast, Heidelberg Materials’ Brevik plant is rewriting what “green cement” means. As the world’s first industrial-scale carbon capture and storage (CCS) facility in the cement industry — inaugurated in June 2025 as part of the Norwegian government’s Longship initiative — the plant captures 400,000 tonnes of CO₂ every year, equivalent to 50% of its total emissions. The result is evoZero®, the world’s first carbon-captured near-zero cement, now being delivered to customers across Europe. Early adopters include Oslo’s new Skøyen Station and the DREIHAUS 3D-printing housing project in Germany.

    Holcim: Turning Lower Emissions into
    Higher Market Value02

    Holcim’s low-carbon cement portfolio, engineered with 30%+ lower CO₂ intensity, targets premium green construction projects. The strategy is direct: cut emissions, raise demand, lead the market.

    Key Decarbonisation Levers

    • Clinker substitution: up to 40% emission reduction potential
    • Alternative fuels: approximately 25% reduction contribution
    • Carbon capture: largest long-term impact; European studies show combining these measures can reduce emissions by 58% without CCS and up to 88% with CCS by 2050

    The European cement industry is steering towards a 37% CO₂ cut by 2030 and Net Zero by 2050. But these targets are not achievable through innovation alone. They require the silent third pillar: process reliability.

    Process Reliability: The Hidden Driver of Net Zero Success

    While energy efficiency and sustainability innovation capture headlines, process reliability is the silent enabler of both. Cement plants operate continuous high-temperature processes (>1400°C) where unplanned downtime leads to massive energy losses, production inefficiencies, and increased emissions per tonne.


    This is where the MIT Sloan Management Review India research delivers a sobering reality check. The study’s findings reveal that the industry’s biggest challenge is not the absence of AI — it is the persistent gap between AI-generated insight and reliable plant-floor execution.

    The Contextualization Gap: Why Models
    Fail in Real Plants01

    The MIT SMR India study identifies a “Contextualization Gap” that directly constrains prediction accuracy and, by extension, process reliability outcomes:

    • 62% of respondents: cite data fragmented across multiple systems as the single most referenced barrier to effective AI deployment.
    • 71%: lack sufficient context regarding process constraints — including safety boundaries and throughput commitments.
    • 59%: report inadequate maintenance history, often due to uninterpreted paper logs or knowledge retained informally by veteran technicians.
    • 53%: lack visibility into throughput interdependencies, limiting a model’s ability to understand how a single asset failure propagates downstream.

    Key Finding: Data quality and availability constraints do not merely reduce prediction accuracy at the margins. They define the ceiling of accuracy that any model can achieve, regardless of its architectural sophistication.

    The Trust Threshold: Why Operators Withhold Confidence02

    The research reveals that confidence in industrial AI behaves as a threshold rather than a gradual progression. The industry remains in a state of withheld judgement:

    • 44% of respondents: remain neutral — awaiting plant-specific proof of reliability before committing trust.
    • 56%: cite false positives as the primary trust eroder, generating alert fatigue and reducing willingness to act.
    • 38%: report breakdowns at the point of execution — where an alert identifies an issue but does not clearly specify how to execute the repair within operational and safety constraints.

    As one maintenance professional in the MIT SMR India study observed: in complex brownfield plants, 80% of flagged anomalies represent operational changes rather than mechanical defects. At this ratio, repeated investigation of non-actionable alerts erodes trust across all AI outputs.

    Why Process Reliability Matters to Net Zero

    Reliability Condition Net Zero Impact
    Stable kilns Optimal fuel consumption, lower specific energy
    Reduced unplanned breakdowns Lower waste, reduced reprocessing, fewer emission spikes
    Consistent operations Predictable emissions, reliable ESG reporting
    Higher uptime → higher throughput Amortises fixed-cost decarbonisation investments across more tonnes

    How PlantOS™ Closes the Loop: From Insight to Validated Outcome

    To fully unlock the convergence of energy efficiency, innovation, and process reliability, cement manufacturers need more than monitoring dashboards or disconnected predictive tools. They need a prescriptive AI platform that closes the loop between prediction and validated outcome. This is where Infinite Uptime’s PlantOS™ becomes critical.


    The MIT SMR India research introduces the Trust Loop framework — a structured cycle where machine data, human expertise, and operational execution converge. PlantOS™ operationalises this framework through four interdependent phases:

    Trust Loop Phase What PlantOS™ Delivers Net Zero Impact
    Deep Asset Contextualization Integrates data from PLCs, DCS, SCADA, energy meters, CMMS, and ERP into a single operational layer Asset-level energy tracking; eliminates fragmented data silos
    Prediction & Prescription Quality Context-aware failure detection with root cause identification and actionable maintenance guidance Prevents unplanned downtime; reduces emission spikes from restarts
    Operational Execution Human-in-the-loop validation; prescriptions embedded into maintenance workflows Higher MTBF; consistent operations = predictable emissions
    Validation & Verification Post-intervention performance verification; user-validated outcomes logged Real-time ESG reporting; attributable ROI for decarbonisation investments

    Field Evidence: The Star Cement Deployment

    At Star Cement, PlantOS™ was deployed across four plants, integrating data from 19 existing systems — PLCs, DCS, energy meters, SAP, maintenance logs, and quality reports — without adding new sensors. The deployment created plant-wide context from existing infrastructure, delivering:

    • 46 hours: of prevented unplanned downtime
    • 10 tons/hour: increase in throughput
    • ~920,000 kcal: reduction in specific heat consumption
    • ~5%: lift in Mean Time Between Failures
    • 10x ROI: in under six months
    • 99%: of prescriptions acted upon and outcomes validated by plant teams

    “The biggest change was the immediate establishment of a single source of truth. We moved from reactive chaos to proactive control.”— Dhawan Soni, Electrical and Instrumentation Head, Star Cement

    The Contextualization Gap: Why Models
    Fail in Real Plants01

    The MIT SMR India study identifies a “Contextualization Gap” that directly constrains prediction accuracy and, by extension, process reliability outcomes:

    • 62% of respondents: cite data fragmented across multiple systems as the single most referenced barrier to effective AI deployment.
    • 71%: lack sufficient context regarding process constraints — including safety boundaries and throughput commitments.
    • 59%: report inadequate maintenance history, often due to uninterpreted paper logs or knowledge retained informally by veteran technicians.
    • 53%: lack visibility into throughput interdependencies, limiting a model’s ability to understand how a single asset failure propagates downstream.

    Key Finding: Data quality and availability constraints do not merely reduce prediction accuracy at the margins. They define the ceiling of accuracy that any model can achieve, regardless of its architectural sophistication.

    This directly addresses the MIT SMR India finding that 70% of Digital and IT leaders report uncertainty about which system serves as the authoritative source of asset context — even in organisations that consider their technology stacks fully integrated.

    Energy Efficiency as a Profit Engine

    Energy accounts for up to 30–40% of cement production costs, making efficiency a direct lever for profitability. European leaders have aggressively optimised thermal and electrical consumption through waste heat recovery systems, advanced kiln optimisation, and electrification paired with renewable power sourcing.


    According to the IEA/OECD Technology Roadmap, improving energy efficiency is one of the primary carbon mitigation levers in the cement sector. EU best-in-class thermal efficiency targets are converging toward 3.16 GJ/ton clinker, demonstrating incremental gains through process optimisation.


    Holcim, for instance, integrates energy-efficient building solutions and low-carbon cement products while aligning with Science Based Targets Initiative (SBTi)-validated net-zero pathways. The financial logic is clear:

    Energy Lever Mechanism Financial Impact
    Lower fuel consumption WHRS, kiln optimisation Reduced operating cost
    Reduced carbon intensity Alternative fuels, clinker substitution Lower EU ETS carbon tax exposure
    Electricity optimisation Renewable sourcing, load balancing Improved EBITDA margins

    MIT SMR India Research Insight: The MIT Sloan Management Review India study finds that 50% of respondents report asset, process, and energy data are not linked in their current systems. Without this integration, energy optimisation remains siloed — divorced from the process context and maintenance realities that determine whether efficiency gains are sustained or eroded by unplanned downtime.

    Key Takeaways

    • Energy Efficiency = Direct Profitability: Every kilowatt saved reduces cost and carbon exposure simultaneously. But efficiency gains are only sustained when equipment runs reliably.
    • Sustainable Innovation = New Revenue Streams: Green products like evoZero® are creating premium markets. But process reliability determines whether these innovations deliver at scale.
    • Process Reliability = The Foundation for Net Zero: MIT SMR India’s research confirms that trust in AI is an evidence challenge, not a technology challenge. Practitioners need real use cases from comparable plants, contextually grounded models, and validated outcomes.
    • The Trust Loop Is the Missing Operating Layer: Companies that close the loop between context, prediction, execution, and validation — as PlantOS™ enables — convert digital investment into measurable production impact across MTBF, efficiency, and throughput.

    European cement leaders are proving that Net Zero is not a cost burden — it is a strategic growth lever. Companies like Holcim and Heidelberg Materials are aligning energy efficiency, sustainability innovation, and process reliability to unlock both environmental and financial value.


    However, achieving this at scale requires a digital backbone that earns operator trust through demonstrated, validated outcomes. Platforms like Infinite Uptime’s PlantOS™ act as the operational intelligence layer — ensuring that every kilowatt saved, every emission reduced, and every hour of uptime contributes directly to both Net Zero targets and profitability.


    As the MIT SMR India research concludes: trust begins with context and is reinforced through demonstrated accuracy under real operating conditions. The next phase of industrial AI adoption lies in closing the gap between credible prediction and disciplined execution.

    Sources & References

    • https://www.heidelbergmaterials.com/system/files/2026-03/HM_ASR25_en.pdf
    • https://www.holcim.com/sustainability/esg/esg-policies-documents-reports
    • https://www.holcim.com/sites/holcim/files/docs/27022026-holcim-sustainability-statement-2025.pdf
    • https://www.verdantix.com/insights/blog/energy-costs-are-forcing-energy-management-up-the-agenda
    • https://www.mdpi.com/2071-1050/13/7/3810

    Read More on Industrial Energy Efficiency

  • Plant Reliability Beyond Mechanical Faults

    Plant Reliability Beyond Mechanical Faults

    Plant Reliability Beyond Mechanical Faults
    How Process & Electrical Faults Drain Throughput, Energy, and Margin
    Before a Single Alarm Fires

    Read Time: 8–9 minutes  | Author – Kalyan Meduri

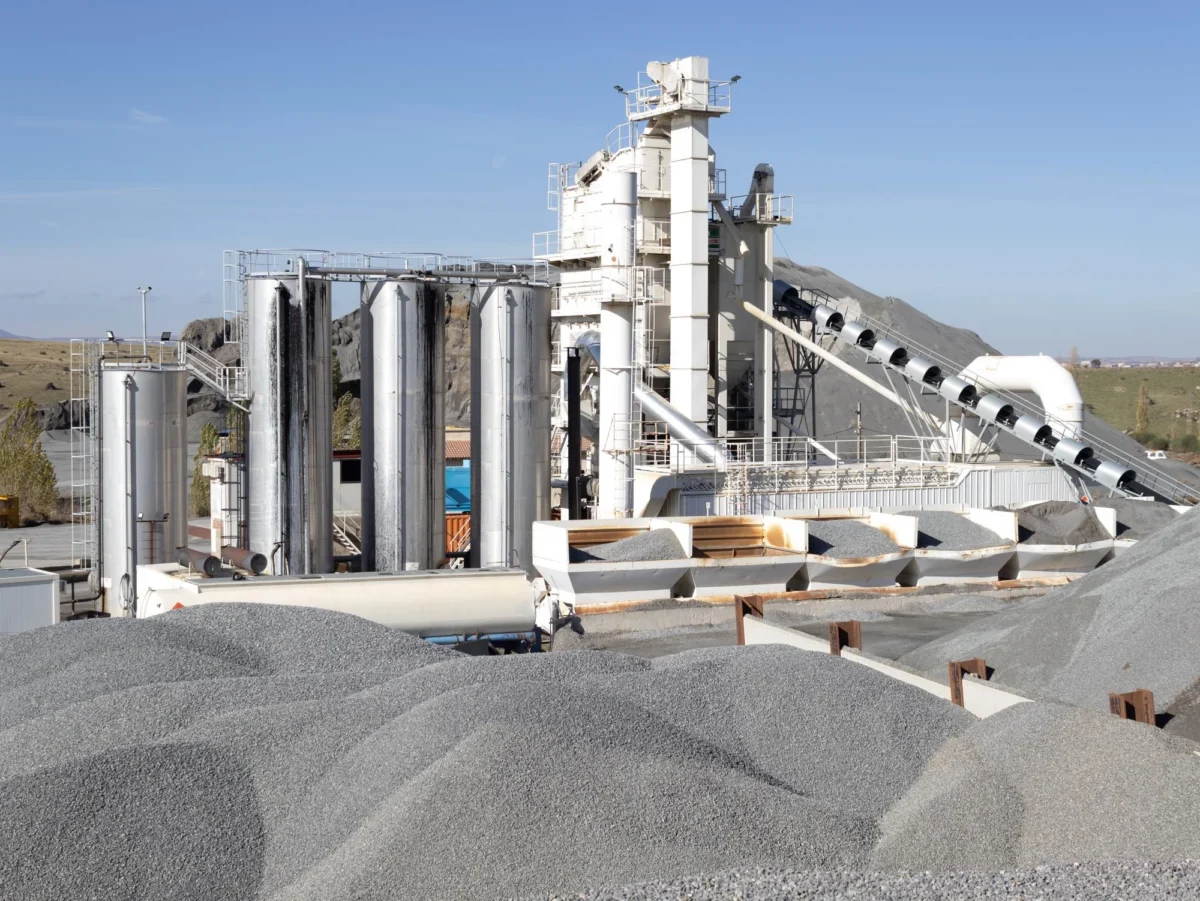
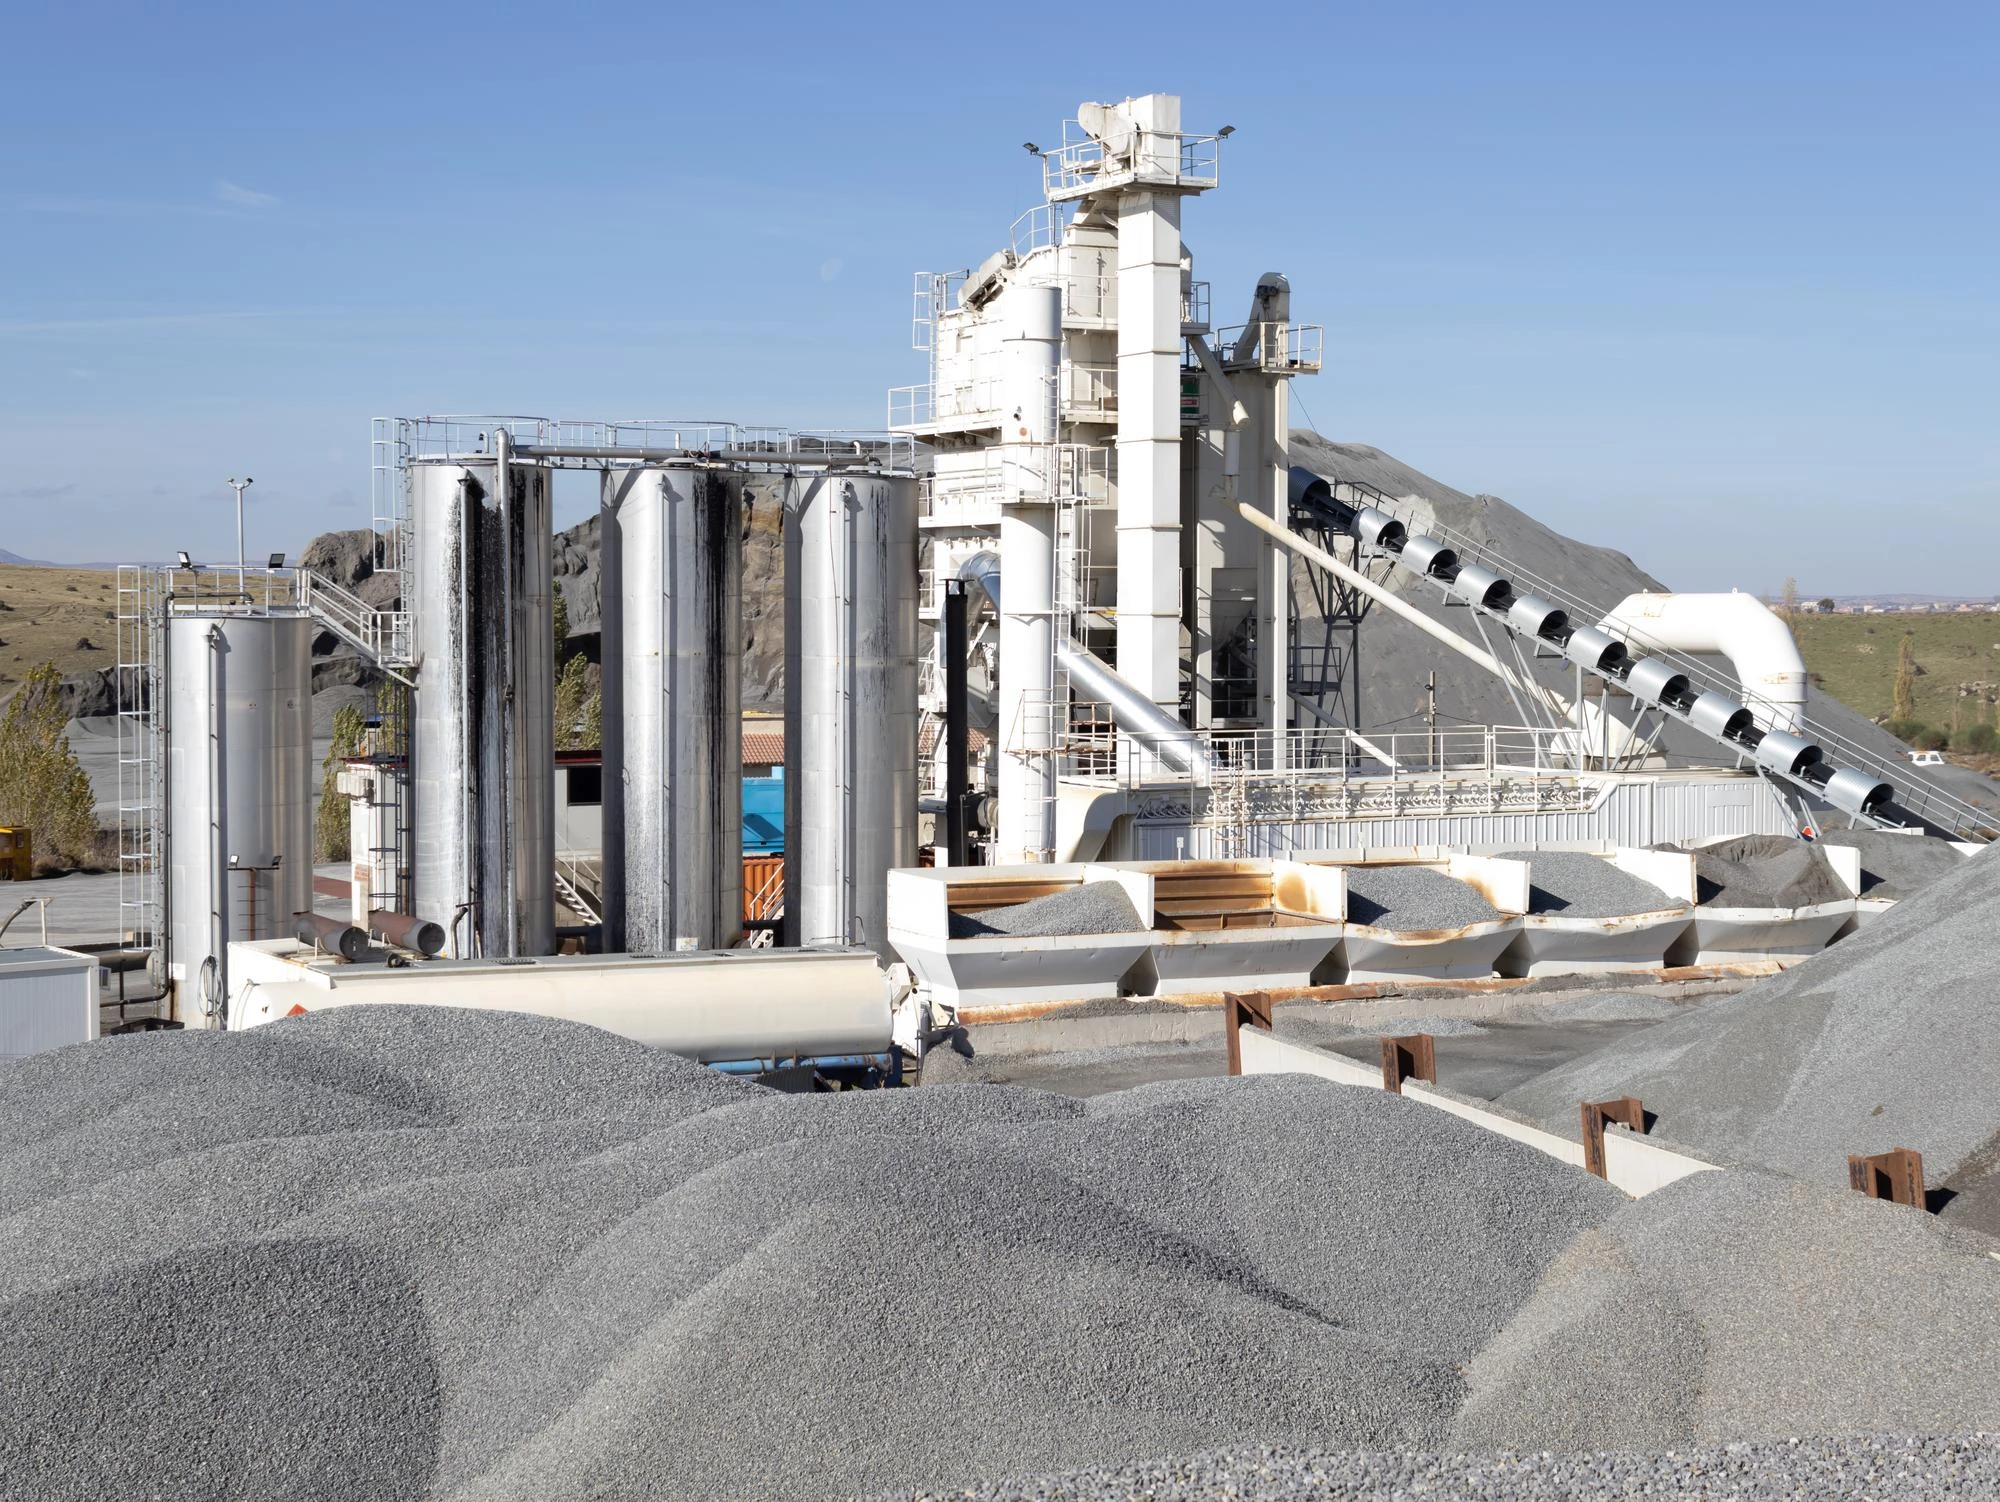
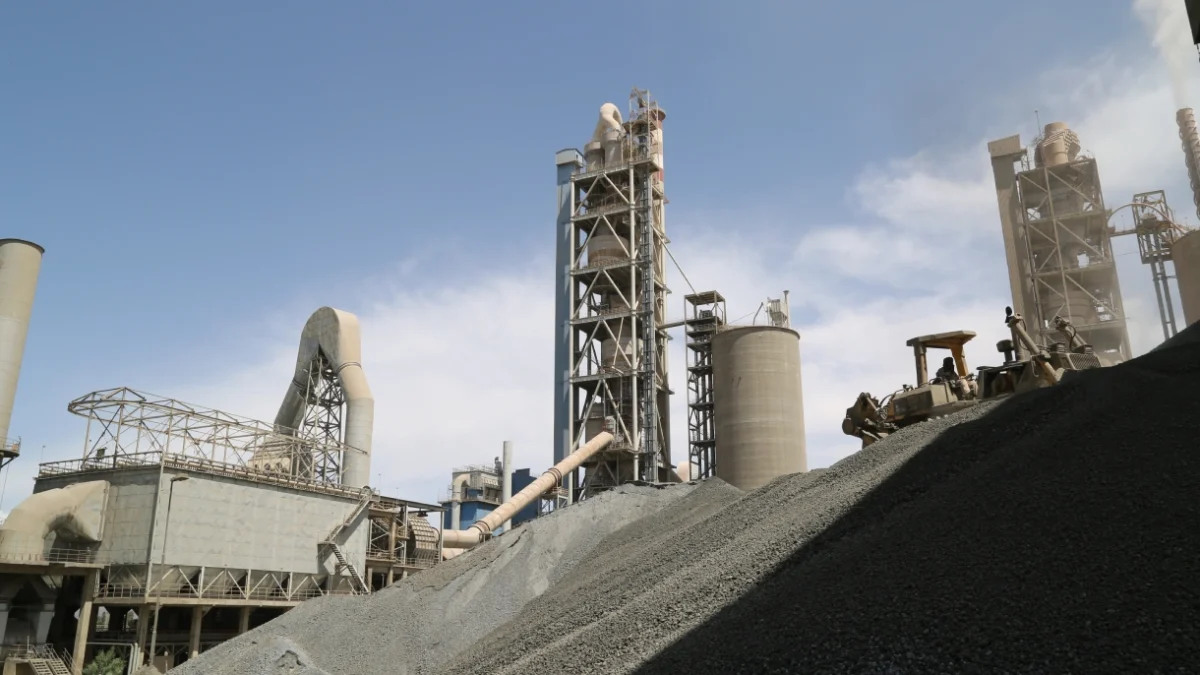
    A large industrial processing site with four tall, cylindrical silver silos on the left and a central white multi-story machinery tower. A long diagonal conveyor belt extends to the right. In the foreground and background, there are massive, undulating mounds of grey crushed gravel under a bright, clear sky.

    Key Highlights

    • Cement plants silently bleed 10–20% throughput and 5–8% additional energy when
      mechanical, electrical, and process faults go undetected across VRMs, preheaters, kilns, and
      fans—often weeks before a single alarm fire.
    • Start Cement India & several leading cement manufacturers deployed PlantOS™ and the
      99% Trust Loop™ to intercept three fault events before they cascaded: VRM classifier
      bearing distress, a false Preheater ID Fan sensor trip, and Kiln hood draft reversal.
    • At Star Cement India alone, PlantOS™ preserved 46 hours of production, recovered ≈600
      tons of clinker output, and avoided 920K kCal of specific heat waste—each with a digitally
      validated prescription, not a hypothesis. Delivering 10X RoI within 6 months.

    PlantOS™ Outcomes Footprint — As of 17 March 2026; Digitally verifiable live on PlantOS™ Digital Reporting System

    Plants Digitalized
    9 industrial verticals globally
    0
    Downtime Hours Saved
    globally (all verticals)
    0
    Cement Plants
    digitalized
    0
    Cement Hours
    downtime eliminated
    0
    Payback
    vs 18–24 months industry average
    <=6 Mo
    All verticals: 881 plants across 9 industrial verticals globally. Cement vertical: 137 plants, 30,459 hours eliminated, 9,312 breakdowns
    avoided. Payback: <=6 months vs. typical digital projects 18–24 months.

    Prescriptive AI for Cement Plants: From VRM Gearbox Failures to
    Preheater Trips to Kiln Hood Draft Instability

    For a mid-size cement plant, a single unplanned outage costs $20,000–$300,000+ per day in lost production.
    Across a year, that compounds to $2–5 million in preventable losses—most of it traceable to faults that were
    detectable weeks or months before any alarm fired. VRM gearbox failures alone carry $500K–1.2M in repair
    costs
    and 3–6-week lead times. A preheater ID fan trip can cascade to 245 TPH of kiln feed loss in minutes.
    Restart energy penalties add $3,000–8,000 per incident.


    This document walks through three distinct fault families—mechanical, electrical, and process—through the lens
    of Star Cement India and leading cement manufacturers globally, showing precisely how PlantOS™ intercepted
    each fault before it hit the P&L, and what the verified operational outcome was.

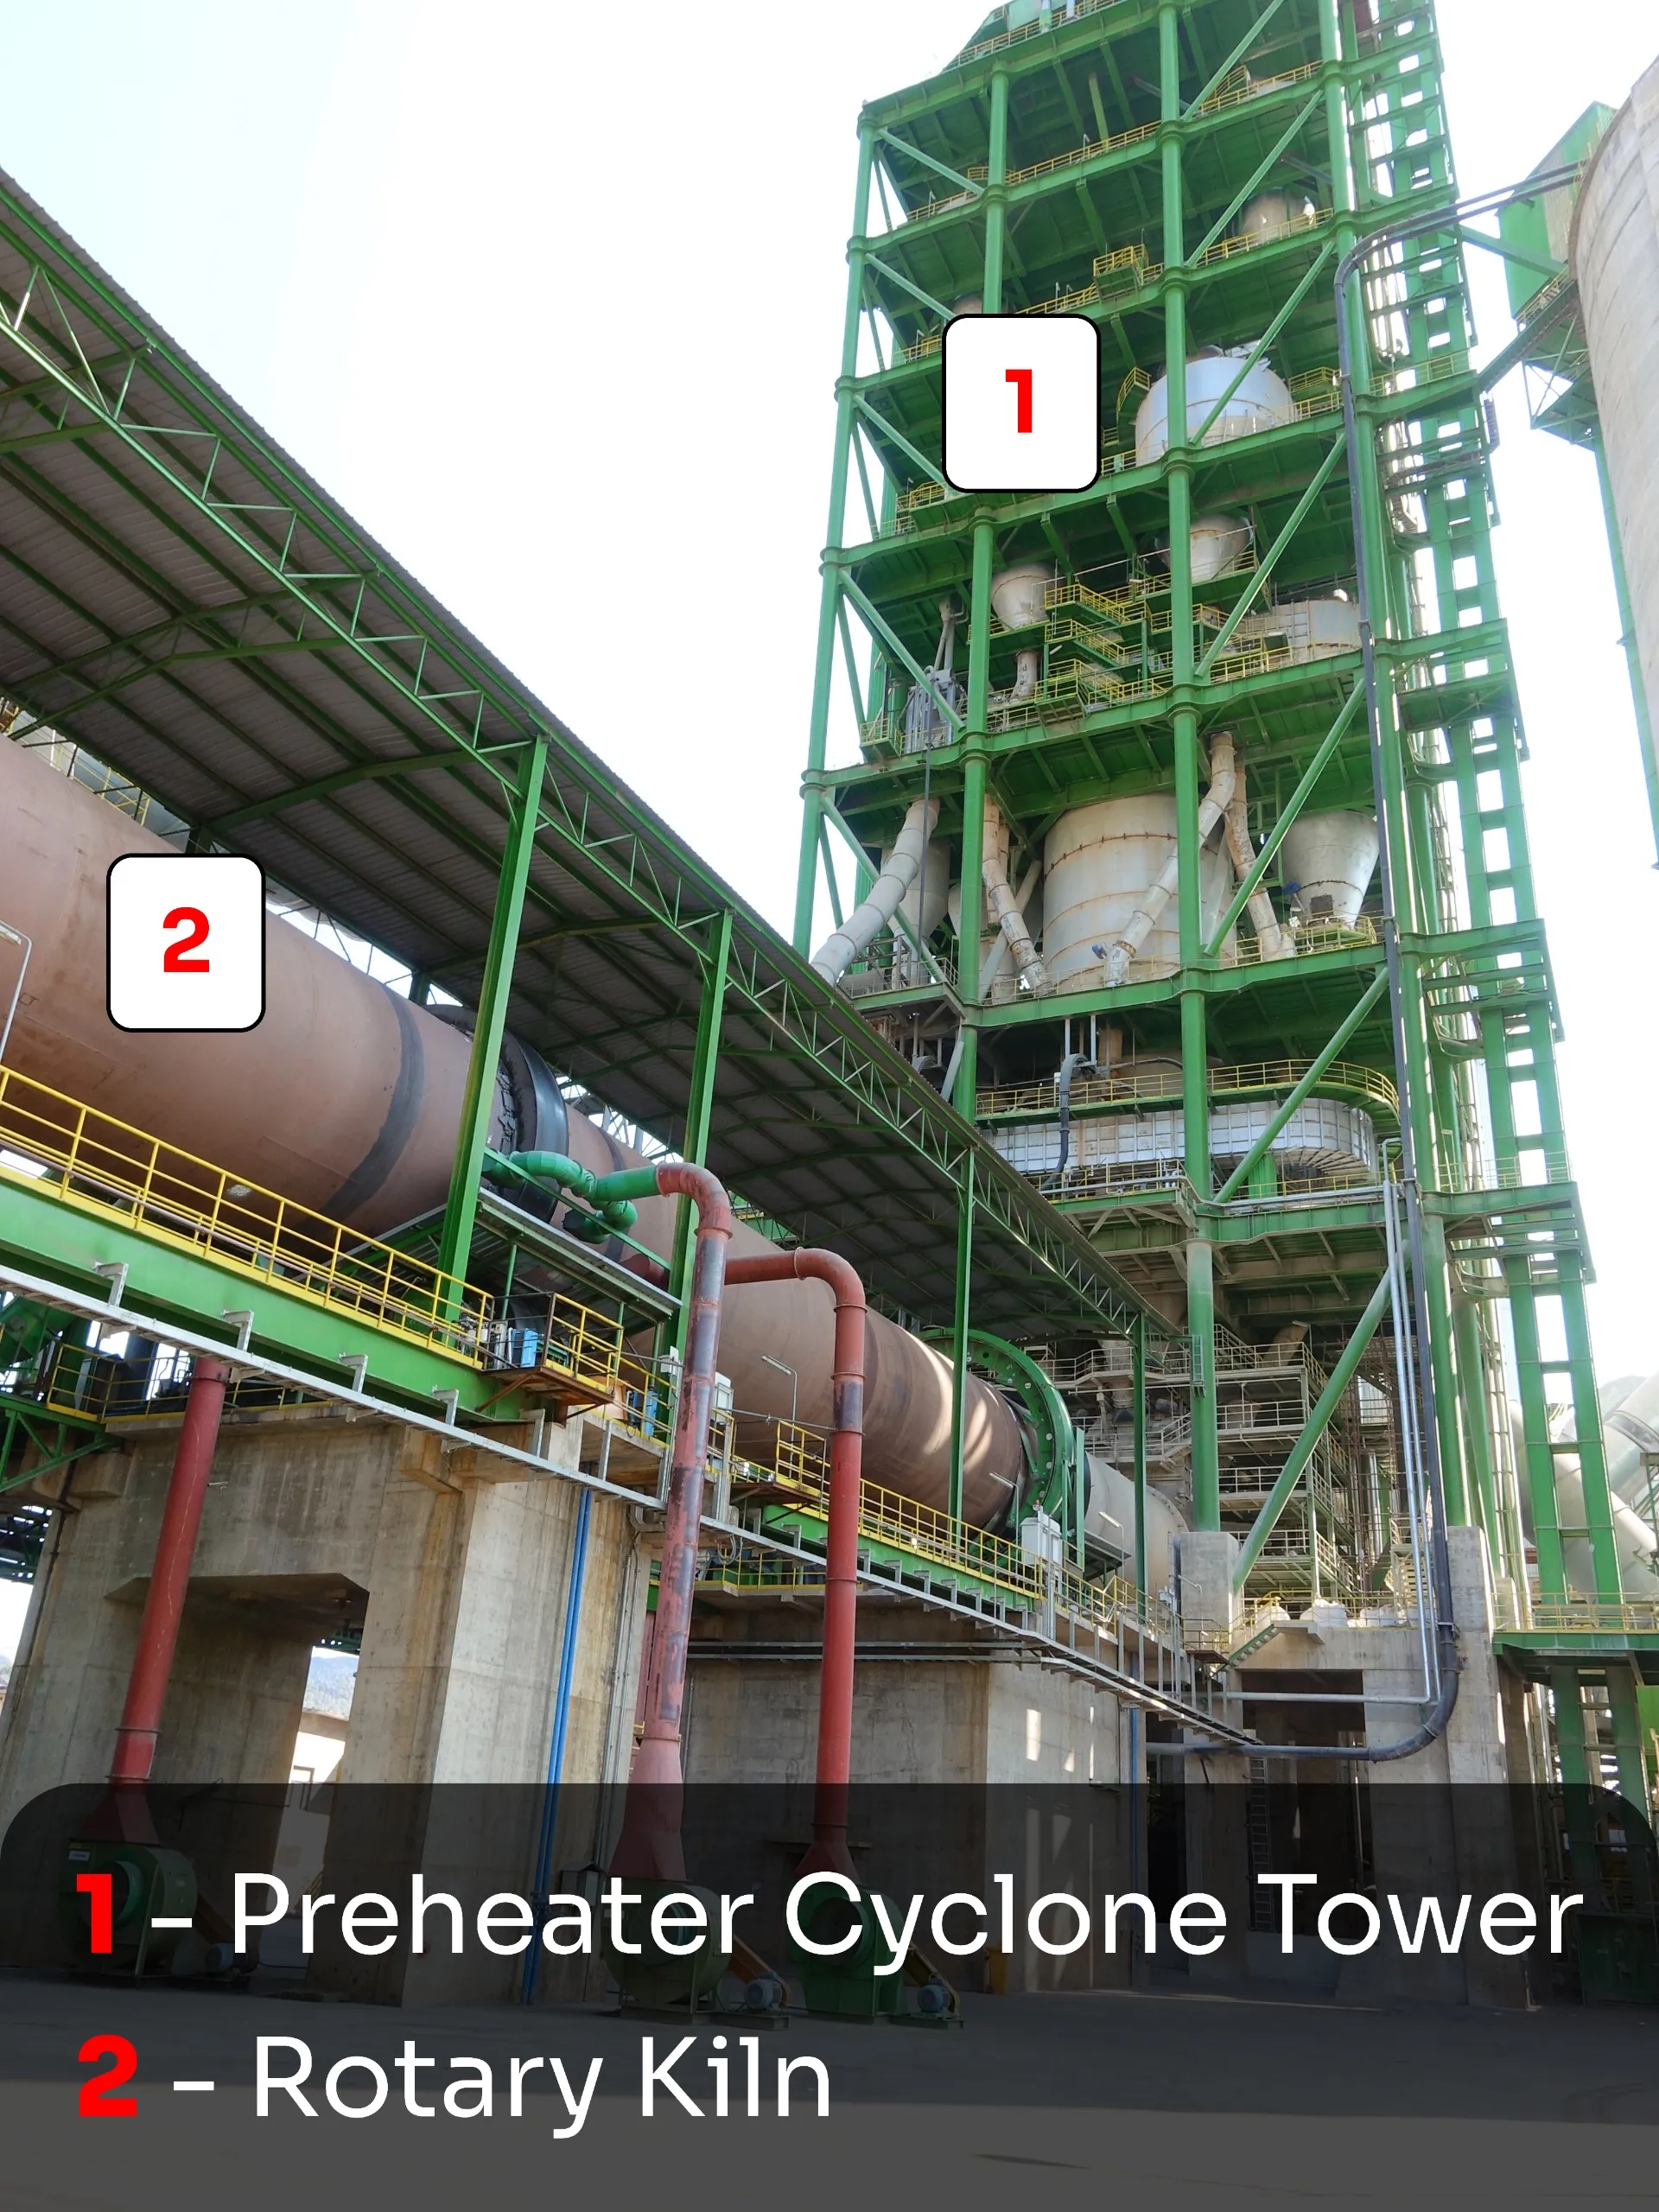
    An industrial photograph of a cement manufacturing facility with two main components numbered for identification. A tall, green steel-framed structure is labeled with a red number "1," identifying it as the Preheater Cyclone Tower. Next to it, a massive, long horizontal cylinder is labeled with a red number "2," identifying it as the Rotary Kiln. The structures are viewed from a low angle against a clear sky.

    Mechanical Faults in Cement Vertical Roller Mills (VRMs)01

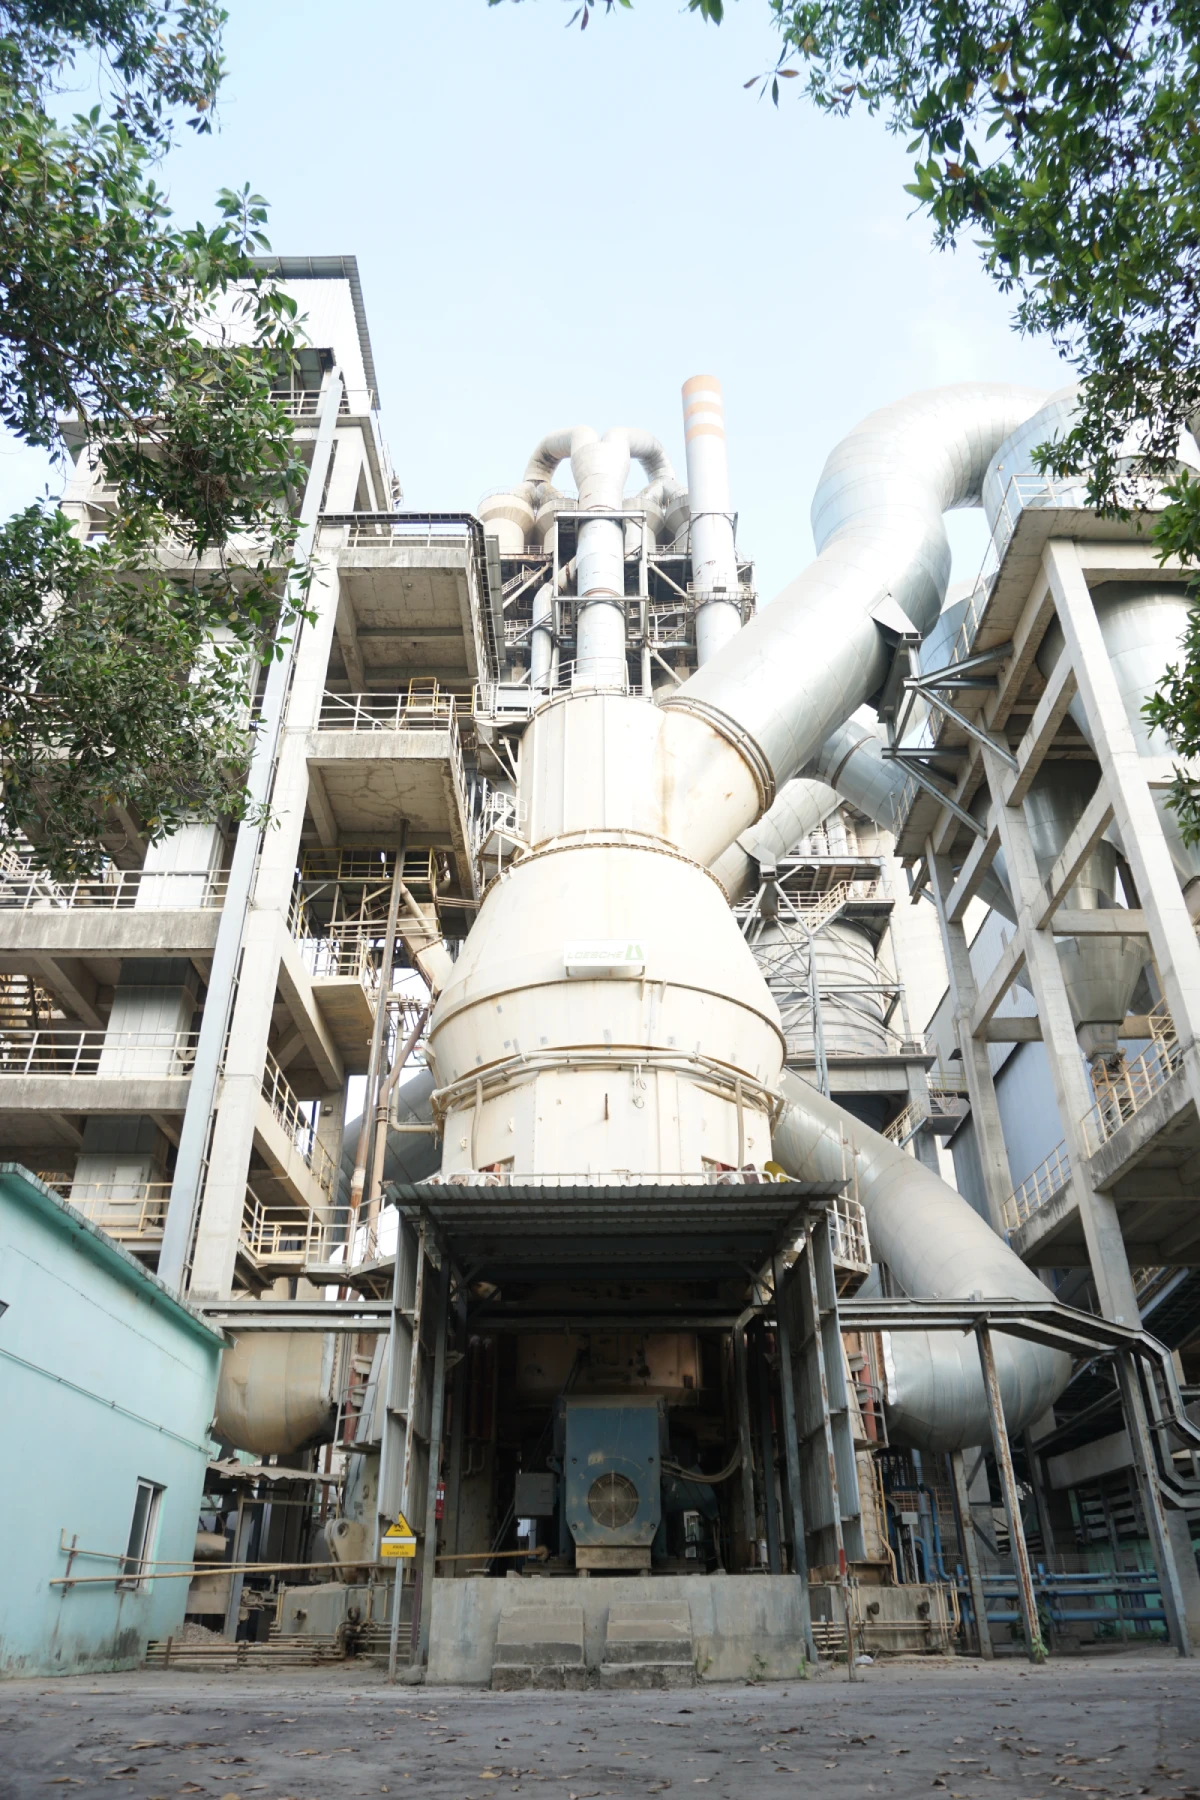
    VRMs handle raw meal grinding at the front of the production line. The classifier motor at the mill top separates
    fines from coarse material; its Drive End (DE) and Non-Drive End (NDE) bearings are high-load, high-speed, and
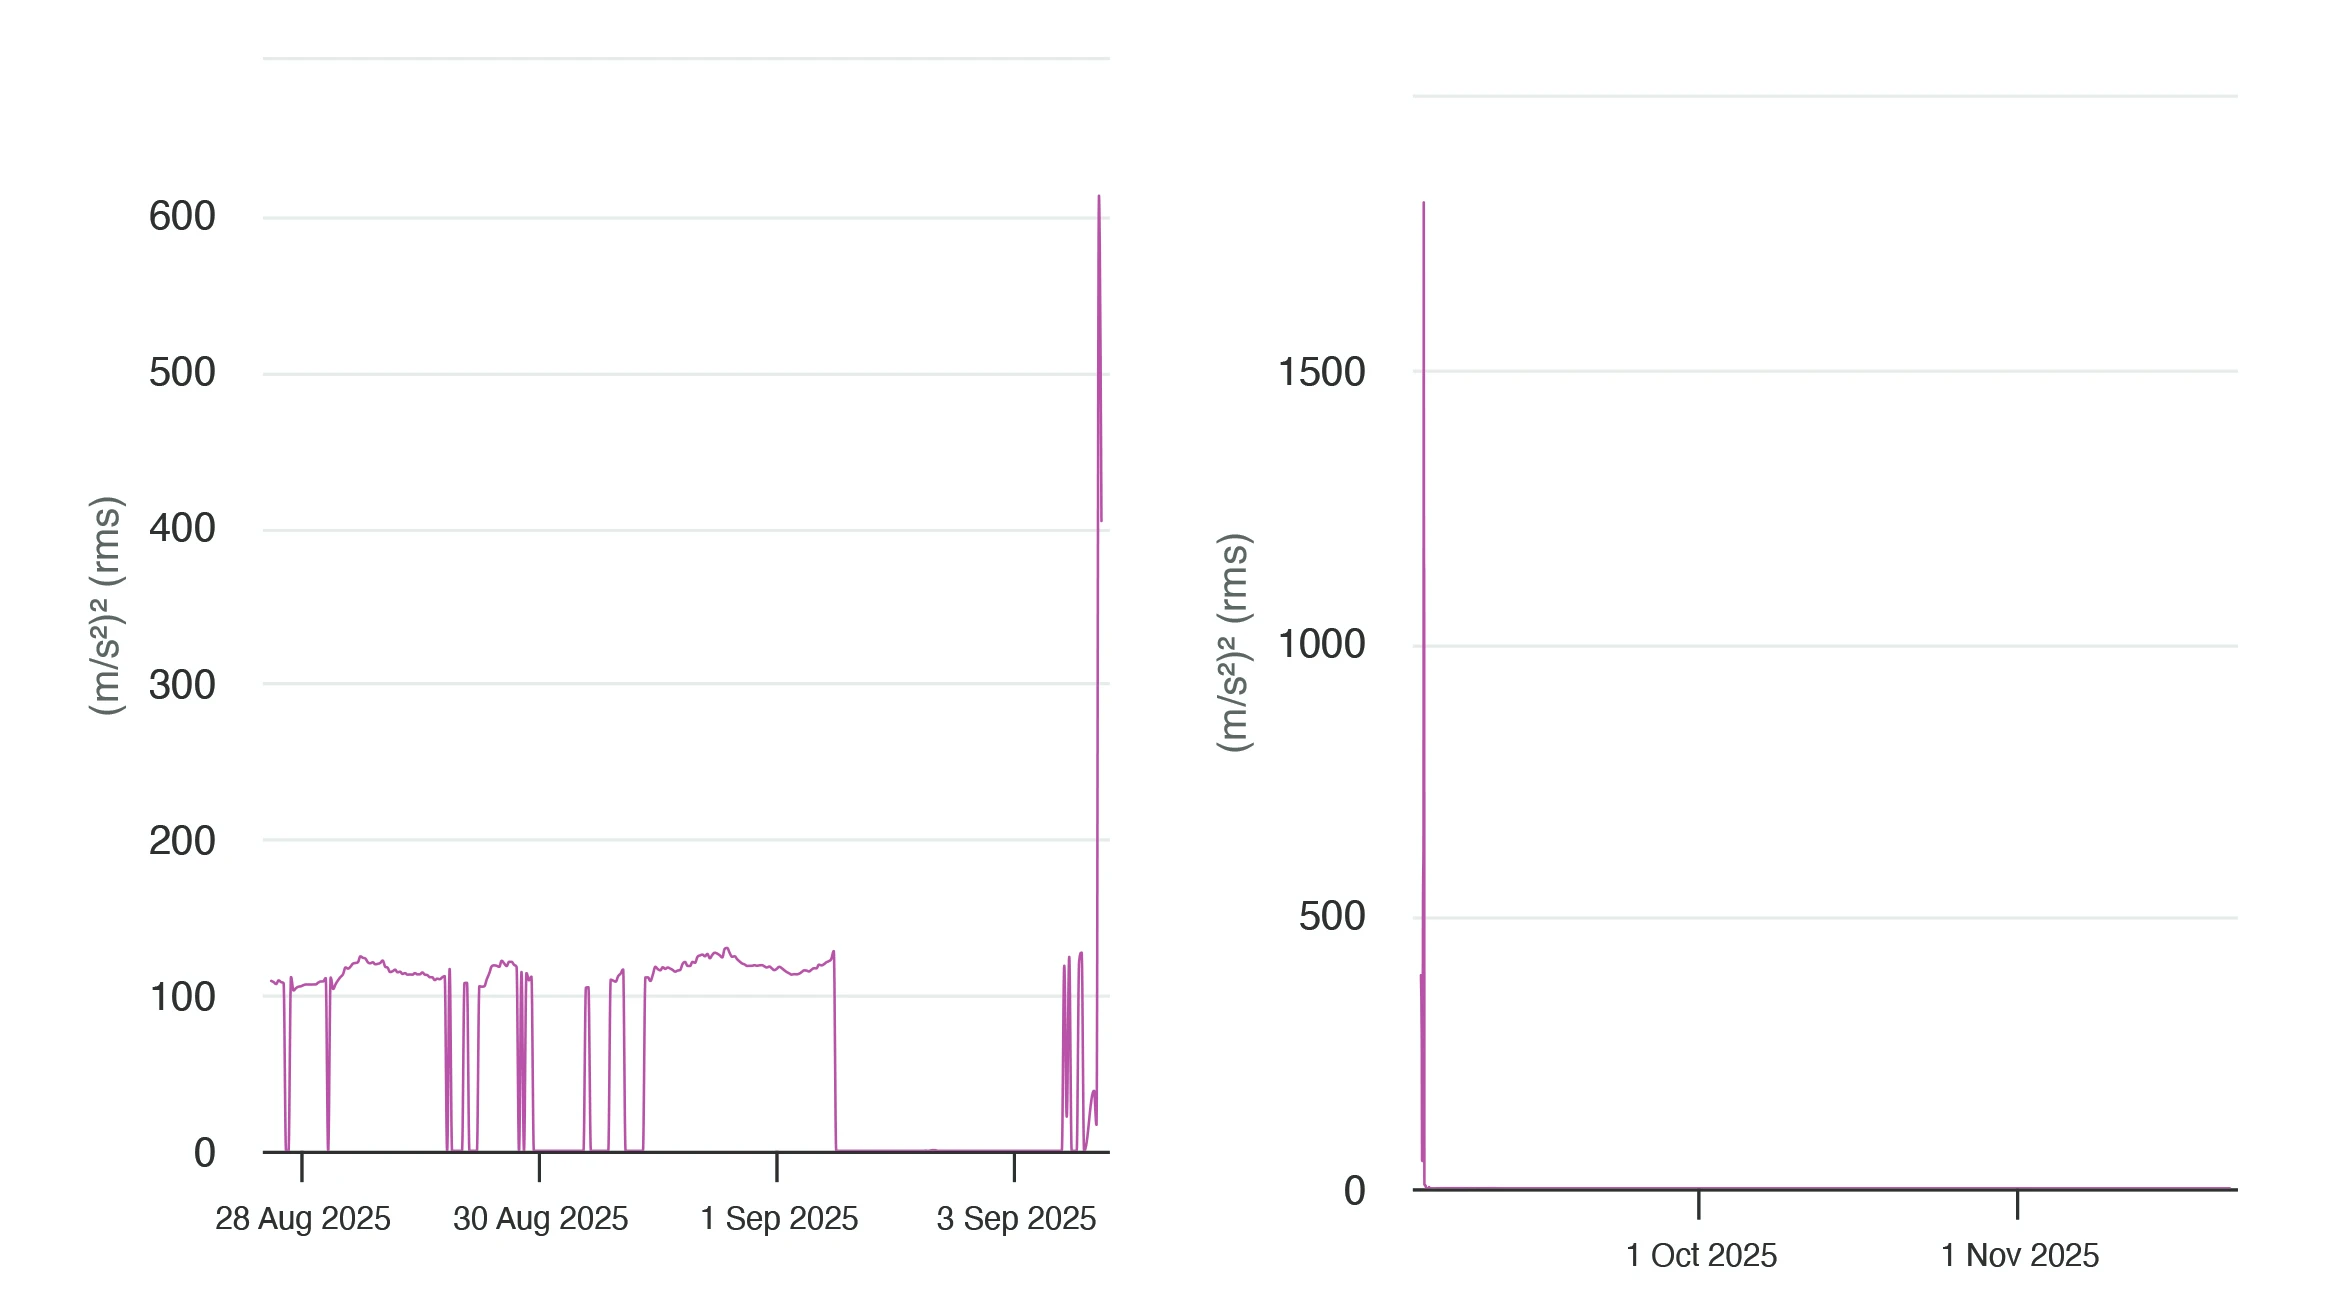
    intolerant of lubrication gaps. Bearing distress manifests as rising acceleration (m/s²)² values well before a
    catastrophic failure—the window for intervention is wide, but only if sensing and analytics are present.

    Common mechanical fault modes:

    • Bearing lubrication deficiency: Dry NDE/DE bearings spike broadband acceleration.
    • Misalignment: Motor-gearbox coupling gaps drive velocity peaks.
    • Roller/table wear: kHz-range impacts from spalling under load.
    • Gearbox degradation: Planetary wear generating characteristic BPFO harmonics.

    Live Incident: Classifier Motor Bearing Distress

    PlantOS™ flagged rising vibration on the VRM classifier motor NDE/DE bearings—peak amplitudes reached
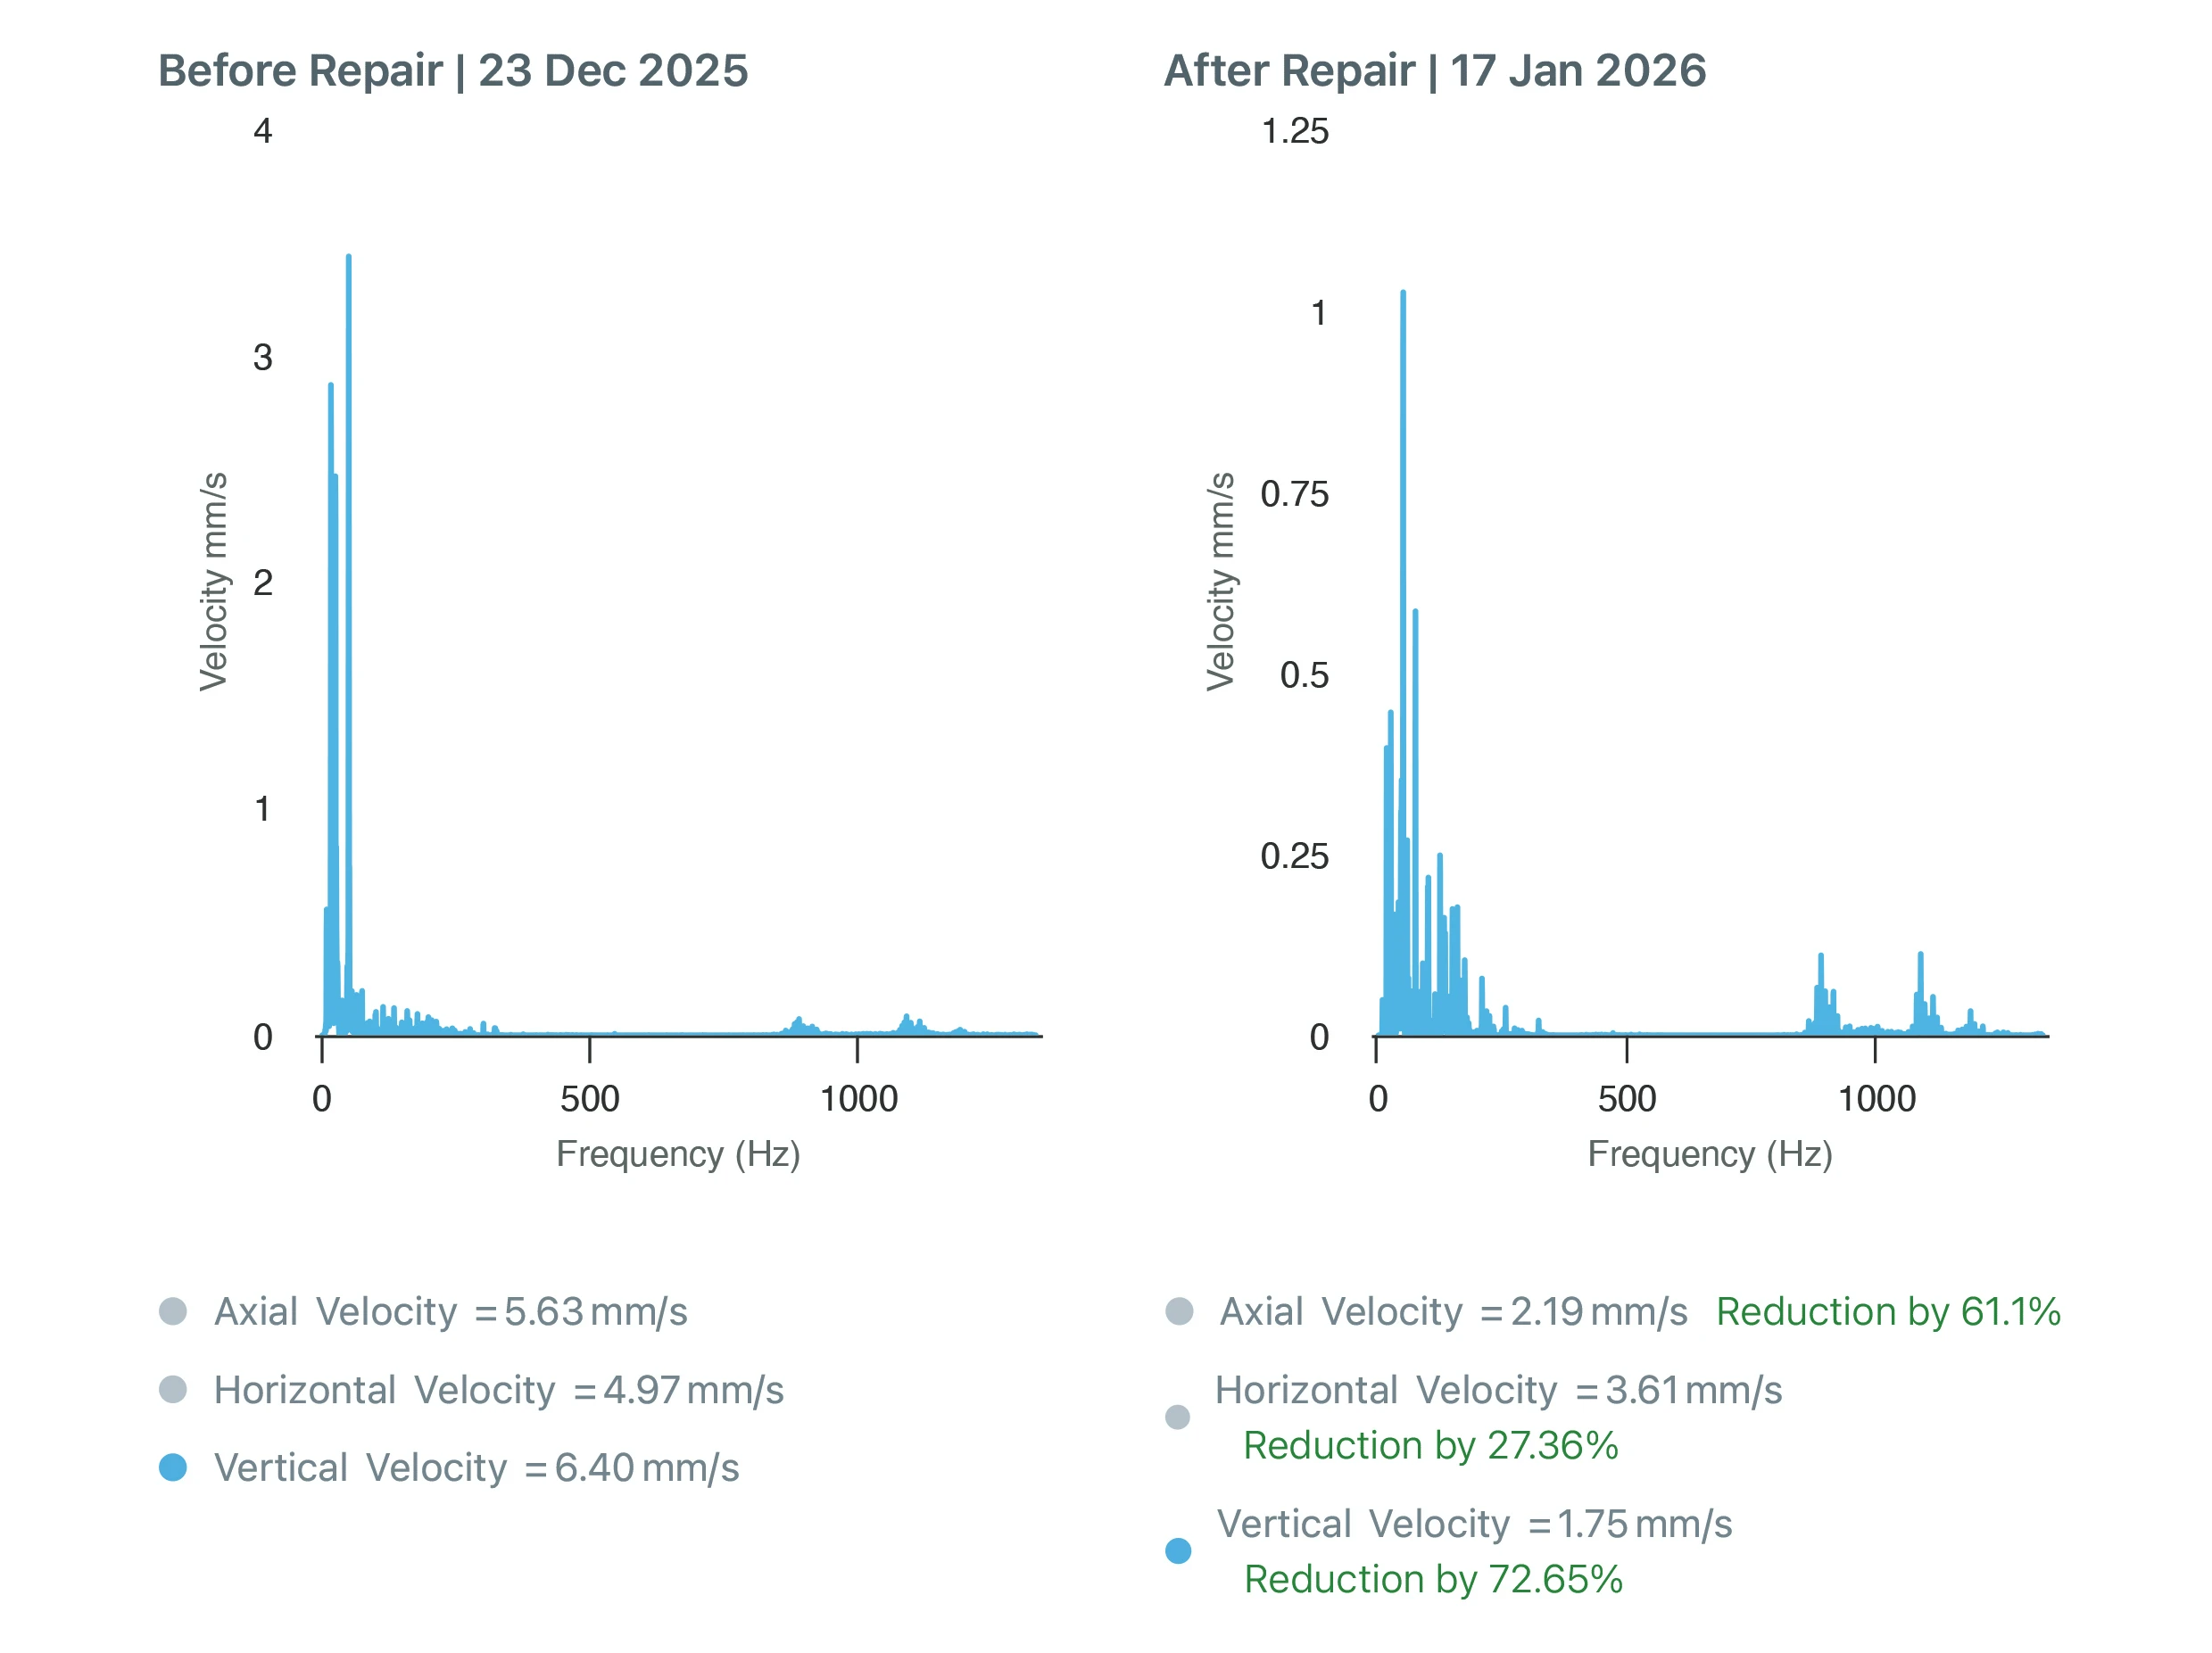
    87.03 (m/s²)² (NDE) and 15.87 (m/s²)² (DE), with axial velocity at 2.18 mm/s pre-repair. Left unaddressed,
    classifier failure coarsens raw meal beyond the 90-micron threshold, disrupting preheater and kiln feed. Estimated
    downtime: 3+ hours for motor teardown and reassembly.Root cause (99% Trust Loop diagnosis):False reading from a faulty sensor and loose terminal connection—not true bearing overheat. Real bearing
    temperatures do not spike 68°C without concurrent vibration or current precursors. The sensor fault mimicked
    catastrophic failure, and the PLC acted on bad data.

    Verified actions and outcome:

    • Re-lubricated NDE and DE bearings Grease matched to bearing designation (SKF 6312).
    • Scheduled maintenance: Weekly greasing and alignment checks; velocity trending established as baseline.
    • Post-repair results: Axial velocity stabilized at 8.54 mm/s; horizontal 10.50 mm/s; vertical 7.28 mm/s—all within operational norms.

    A side-by-side technical comparison of two frequency spectrum graphs titled "Before Repair | 15 Dec 2025" and "After Repair | 18 Jan 2026." The "Before Repair" chart shows a messy, jagged blue area with multiple high peaks across the frequency range, indicating high vibration. The "After Repair" chart displays a clean, sharp single peak at the start of the graph with almost no activity afterward, signifying a return to smooth operation. Text below lists significantly higher Axial, Horizontal, and Vertical velocities for the "After Repair" state.

    Classifier Motor Vibration (mm/s): Before & After Lubrication RepairBusiness Impact: 3 hours downtime prevented. Raw mill reliability maintained. Zero production loss
    from bearing failure.

    Electrical Fault in Cement Preheater ID Fans02

    Preheater towers use hot kiln exhaust gases (~1,000°C) to preheat raw meal to ~900°C across 4–6 cyclone
    stages, cutting fuel consumption 20–30%. The Induced Draught (ID) fans at the preheater base maintain the
    negative draft (-200 to -300 mmWG per stage) that makes this possible. A sensor fault here doesn’t just stop a
    fan—it starves the kiln.

    Live Incident: False Temperature Trip, Real Production Loss

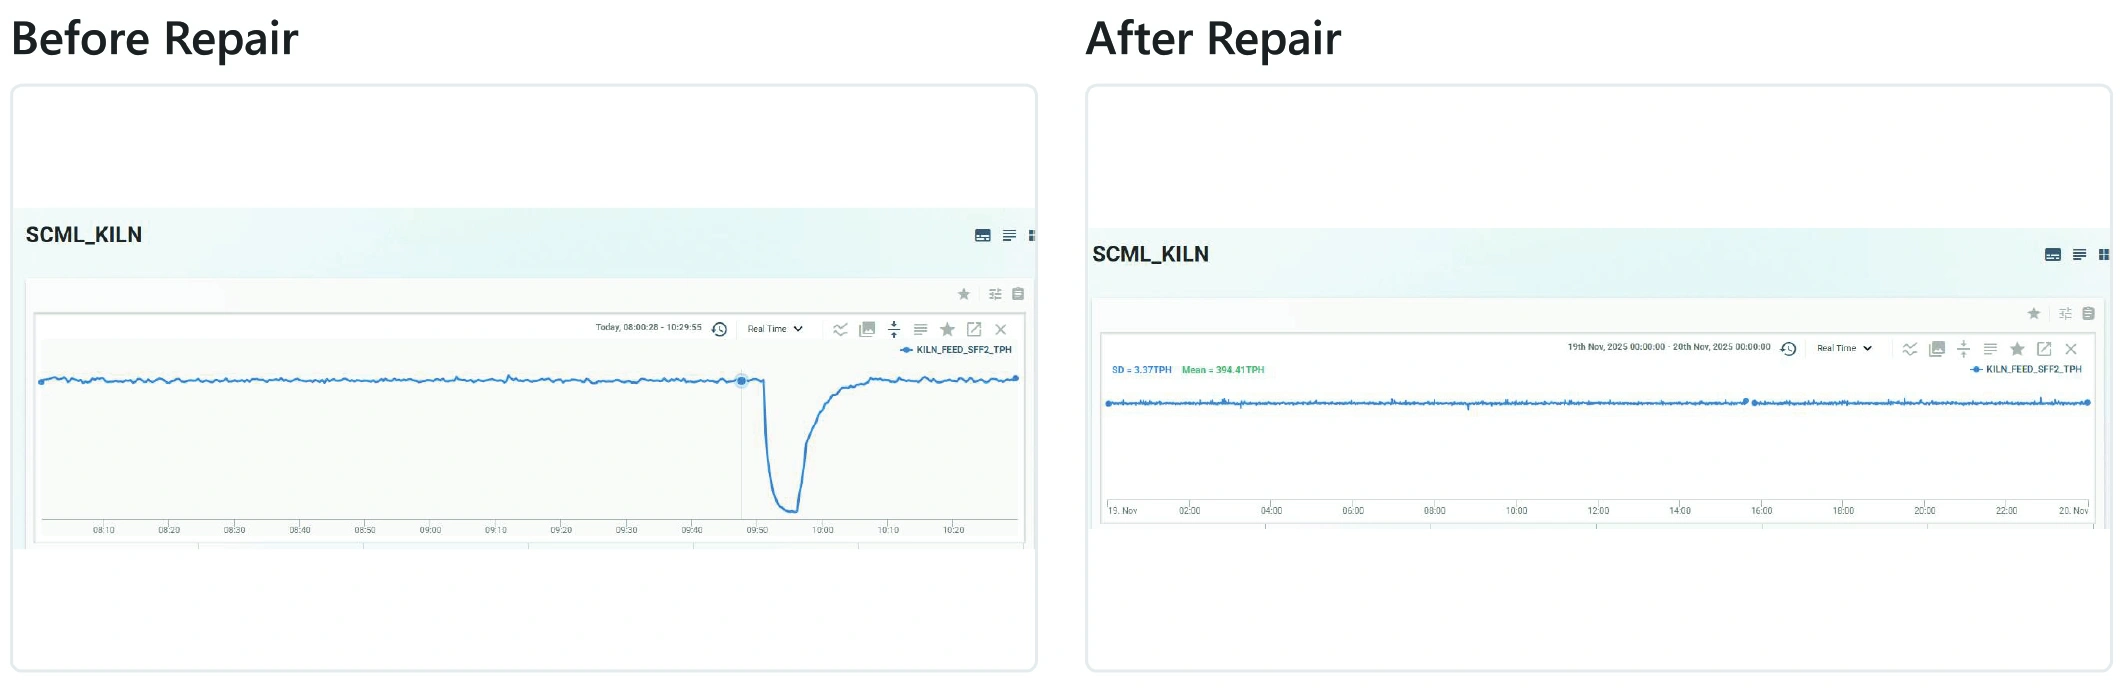
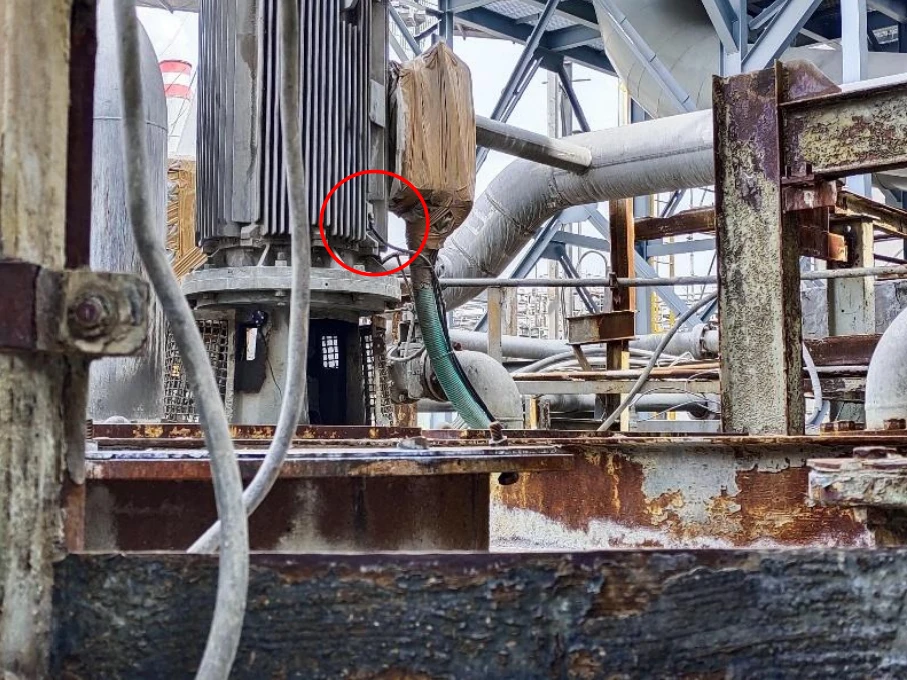
    Preheater Fan 2 auto-tripped after a DE bearing temperature reading jumped from 51°C to 119.6°C within
    minutes. Protective PLC logic halted the fan (850 RPM → 0 RPM) to prevent perceived bearing overheat. The
    consequences were immediate:

    • Cyclone cone pressure on PH string 2 collapsed from -219 mmWG to -30 mmWG—gases could no longer transport raw meal.
    • Kiln feed crashed from 395 TPH to 150 TPH; main drive power fell from 390 kW to 70 kW.
    • Net shortfall: 245 TPH—hours of clinker output gone.

    Root cause (99% Trust Loop diagnosis):False reading from a faulty sensor and loose terminal connection—not true bearing overheat. Real bearing
    temperatures do not spike 68°C without concurrent vibration or current precursors. The sensor fault mimicked
    catastrophic failure, and the PLC acted on bad data.

    Verified actions and outcome:

    • Replaced the terminal block; tested continuity end-to-end with a multi-meter.
    • Updated PLC logic: faulty sensor signals now surface as “NA/0 + alarm” without triggering auto-trip on non-HT fans.
    • Implemented quarterly RTD calibration on critical HT ID fans as standard protocol.
    • Post-fix monitoring over 24–48 hours confirmed: draft restored to -219 mmWG, temperature stabilized at ~51°C, kiln feed held at 395 TPH.

    A side-by-side technical comparison of two line graphs labeled "Before Repair" and "After Repair" for the SCML_KILN. The "Before Repair" chart shows a steady blue line that suddenly drops into a deep, sharp V-shaped dip, indicating a production failure or downtime. The "After Repair" chart shows a consistent, flat blue line across the entire timeframe, representing stable and uninterrupted operation.

    Kiln Feed Throughput (TPH): Before & After Sensor RepairBusiness Impact: 50 tons of production recovered. 5,000 kCal specific heat preserved. Fan
    restarted within hours, no recurrence.

    Process-Induced Faults in Cement Rotary Kilns 03

    The rotary kiln burns preheated raw meal at 1,450°C to form clinker—the irreplaceable intermediate product of
    cement. The kiln hood at the feed end must maintain negative draft (-3 to -10 mmWC) for safe combustion. When
    process parameters—feed rate, draft balance, coating build-up—destabilize this equilibrium, the consequences
    cascade rapidly across the entire production line.

    Common process fault modes:

    • Feed/moisture imbalance overloading rollers and spiking bearing temps.
    • Shell overheat (>350°C) from refractory gaps or flame impingement.
    • Coating build-up at kiln inlet and down-comers restricting airflow.
    • Fan/damper faults causing positive hood draft and reversed gas flow.
    • Calciner instability from coal firing fluctuations driven by draft swings.

    Live Incident: Kiln Hood Draft Reversal

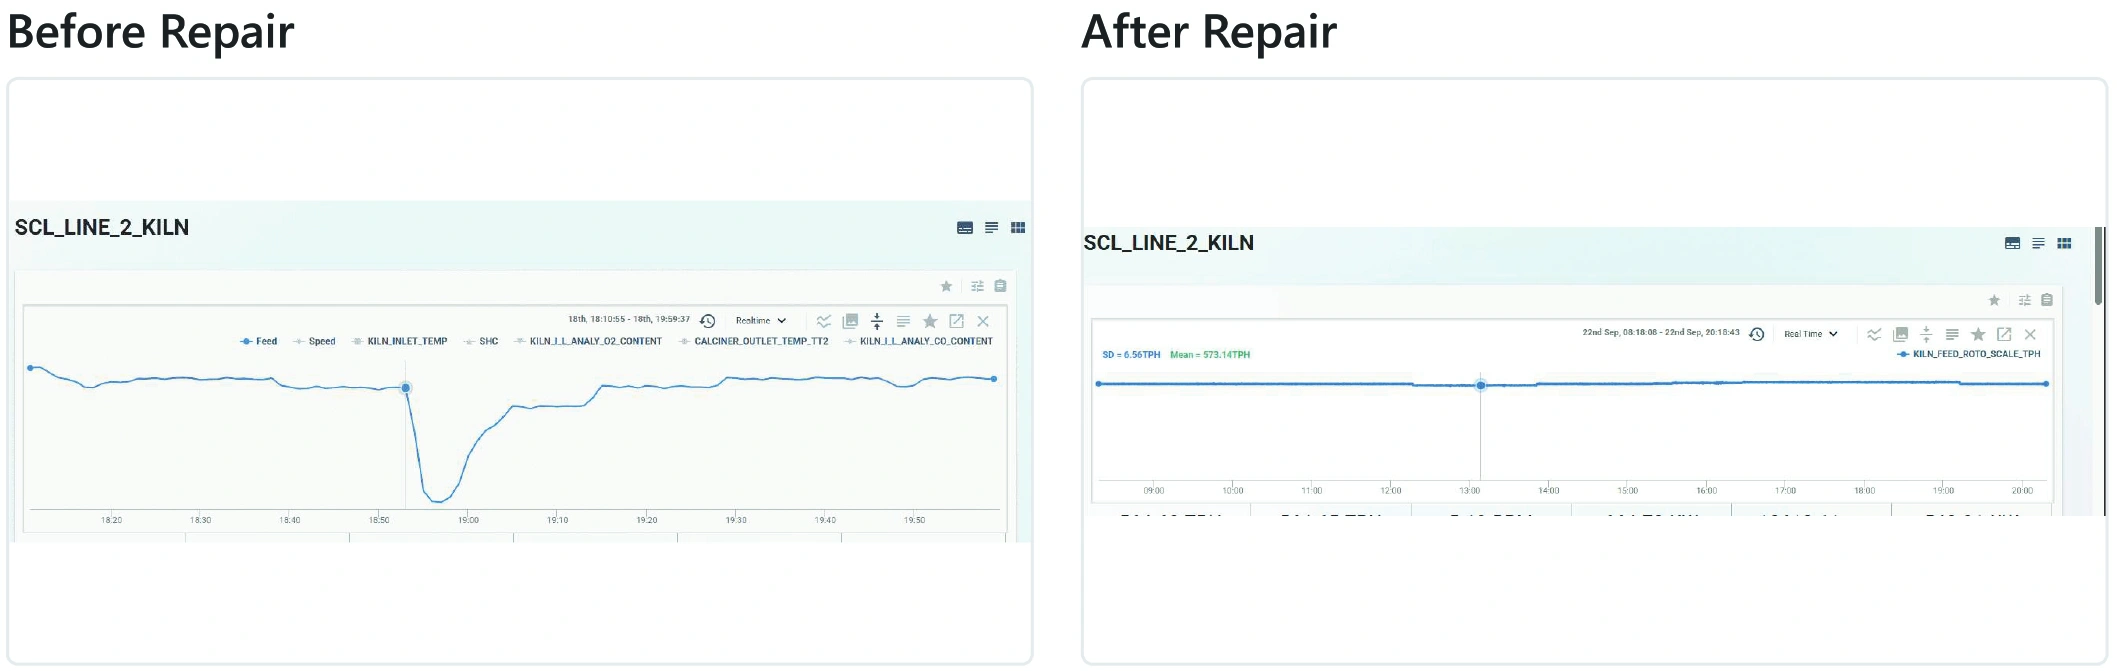
    Kiln feed dropped twice in quick succession—from 561 TPH to 501 TPH and from 571 TPH to 501 TPH.
    Simultaneously, kiln hood draft flipped positive: from -3 mmWC to +12 mmWC. Positive hood pressure risks
    combustion gas blowback and flame instability. The cascade unfolded as follows:

    • Calciner disruption: coal firing fluctuated; outlet and inlet temperatures destabilized.
    • RABH (Raw Meal Auxiliary Bag House) inlet draft blocked, compounding airflow restriction.
    • Sustained shortfall: 60–70 TPH for multiple hours; full stoppage risk active.

    Root cause (99% Trust Loop diagnosis):Material build-up at the TA Duct (Tertiary Air Duct) take-off caused a sudden release, spiking hood pressure
    positive. Coating at the kiln inlet and down-comer, combined with damper imbalance, restricted compensating
    airflow.

    Verified actions and outcome:

    • Installed blasters at TA Duct take-off to clear material accumulation.
    • Added two new pressure transmitters at kiln hood for continuous draft monitoring.
    • Established threshold: maintain hood draft <–3 mmWC; quarterly transmitter calibration.
    • Post-fix: draft stabilized negative; feed restored to 560+ TPH; pre-fix pressure spikes absent in subsequent monitoring.

    Kiln Hood Draft (mmWC): Before &amp; After Intervention

    Business Impact: 500–750 tons of production preserved. 10–15 hours of potential breakdown
    prevented. Kiln stability restored and instrumented.

    PlantOS™ and the 99% Trust Loop™: What COOs, CFOs, and CDOs Need to
    Know

    Cement plants don’t fail from a single catastrophic event—they bleed reliability, throughput, and energy margin
    from fault families that conventional systems miss until they’re already costing money. PlantOS™ interrupts this
    by detecting anomalies across the full production line and delivering prescriptions that are specific, sequenced,
    and closed-loop verified.

    COO Guaranteed plant uptime and capex discipline. Surprise trips become a managed exception, not a recurring cost. TPH targets are protected by prescriptions, not prayers.
    CFO 6–12 month payback vs. the 18–24 month industry norm. Star Cement India reached 10x ROI in under six months. Every prescription carries a financial outcome that is tracked and reported—not estimated after the fact.
    CDO Digitally verifiable AI outcomes—not black-box predictions. The 99% Trust Loop™ closes prediction-to-action-to-validation in one platform, integrating with PLC, DCS, SCADA, historian, SAP, and MES. 99.97% prediction accuracy. 99%+ prescription adoption rate. Outcomes the board can audit.

    Powered by the 99% Trust Loop™, every alert delivers three verifiable outcomes in a single prescription:
    Reliability (zero surprise trips), Throughput (stable TPH, more clinker), and Efficiency (lower SHC, kWh/ton).
    Fault chaos → predictable production wins.

    Frequently Asked Questions


    1. How is PlantOS™ different from traditional condition monitoring or predictive maintenance?


    Most tools stop at trend charts or generic alarms, leaving interpretation to already stretched engineers. PlantOS™
    combines high-fidelity sensing with industry-specific prescriptive AI and the 99% Trust Loop™, so teams receive
    clear, asset- and process-level prescriptions—what to do, where, and why—and then close the loop by confirming
    whether those actions resolved the fault. The outcome is validated, not inferred.


    2. What ROI can a cement plant expect, and on what timeline?


    Global deployments average <=6-month payback—significantly ahead of the 18–24 months typical of industrial digital projects. In cement, plants have translated early fault detection into avoided outages, 10–20% recovered throughput, and up to 2% energy reduction per ton. Star Cement reached 10x ROI in under six months.

    3. What data and systems does PlantOS™ integrate with?


    PlantOS™ functions as a plant orchestration layer, ingesting data from edge sensors, existing vibration/condition
    monitoring systems, PLC, DCS, SCADA, historian databases, SAP, and MES. This enables multi-asset, multi-
    parameter views across VRMs, preheaters, kilns, coolers, and finish mills—so reliability and energy decisions are
    made in full process context, not asset-by-asset silos.


    4. How does the 99% Trust Loop™ reduce false alarms and build leadership confidence?


    The loop closes the gap between prediction and action: PlantOS™ predicts and prescribes, operators execute,
    and outcomes are formally validated inside the platform. Over time, this filters noise, improves models using real
    field feedback, and achieves 99%+ prescription adoption and up to 99.97% prediction accuracy. When PlantOS™
    calls a fault, leadership knows it is both real and actionable—not a noise event.


    5. Is PlantOS™ limited to rotating equipment, or does it cover process and energy?


    PlantOS™ covers the full cement production line: rotating assets (VRMs, fans, mills), process stability (preheater
    draft, kiln hood pressure, cooler performance), and energy performance (SHC, kWh/ton KPI tracking). One
    platform. Three outcome classes. No parallel initiatives.

    See the outcomes for yourself.

    Read the world’s most user-validated prescriptive AI case studies—including Star Cement’s 10x ROI in under six months—to explore how 137 cement plants drive Reliability, Throughput, and Efficiency in 1 prescription, with 0 guesswork.

    Thank you for your interest in PlantOS™ Prescriptive AI.

    Enter your official work email to unlock the World’s Most User-Validated Case Study.[contact-form-7 id=”93f3a5d” title=”pdf downlaod-blog-Plant Reliability Beyond Mechanical Faults”]

    Read More on Industrial Reliability

  • Prescriptive AI for Pumps, Compressors and Agitators

    Prescriptive AI for Pumps, Compressors and Agitators

    Prescriptive AI for Pumps, Compressors
    and Agitators
    Closing the Outcomes Gap in Chemicals and Fertilizer Plants

    Read Time: 8–9 minutes | Author – Kalyan Meduri

    Prescriptive AI for Pumps, Compressors and Agitators Closing the Outcomes Gap in Chemicals and Fertilizer Plants

    Key Highlights

    • How equipment reliability gaps in pumps, compressors, and agitators create
      process variability that kills throughput and spikes kWh per ton in chemicals/fertilizer plants.
    • Why traditional predictive tools stall at generic alerts, leaving process engineers & energy managers to guess the impact on yield, grade, and energy.
    • How PlantOS™ and the 99% Trust Loop turn equipment + process data into
      Equipment + Process Reliability—delivering precise ODRs that stabilize operations and boost throughput.
    • Shop-floor proof: 99.97% diagnosis accuracy, 99%+ operator execution, validated
      downtime savings improvements across 41 chemical/fertilizer plants of the 844 plant footprint globally.

    PlantOS™ Outcomes Footprint — As of March 2026

    Plants Digitalized
    across 9 verticals
    0
    Hours Eliminated
    globally (all verticals)
    0
    Chemical & Fertilizer Plants
    digitalized
    0
    Chemical & Fertilizer Hours
    downtime eliminated
    0
    Payback
    vs 18-24 months industry average
    6-12 Mo

    881 plants across 9 industrial verticals globally. Chemical vertical: 226 plants, 53,208 hours eliminated, 15,255 breakdowns avoided.
    Payback: PlantOS™6–12 months vs. typical digital projects 18–24 months.

    Prescriptive AI for Pumps, Compressors and Agitators

    In chemicals and fertilizer plants, 60–70% of equipment alerts are ignored—not because operators don’t care, but because generic predictions offer no process context, no action, no consequence. The result: small equipment anomalies cascade into yield loss, grade instability, and energy waste that regulators and shareholders won’t tolerate. Equipment + Process Reliability is the antidote, turning unstable operations into predictable throughput machines.


    Pumps cavitating, compressors surging, agitators misaligning—these aren’t isolated failures; they’re process disruptors that force constant adjustments, spiking kWh per ton and eroding margins. PlantOS™’s Prescriptive AI and 99% Trust Loop close this reliability gap, correlating equipment health (vibration, pressure) with process outcomes (flow stability, reaction rates) to deliver operator-validated prescriptions that stabilize the plant.

    Across 844 plants and 9 industrial verticals, PlantOS™ has eliminated 115,704 hours of unplanned downtime. Within the Chemical & Fertilizer vertical alone — 41 plants — the figure stands at 4,138 hours, with 1,921 breakdowns avoided and a 6–12-month payback against an industry norm of 18–24.

    The Process Variability Trap in Chemicals & Fertilizer 01

    In chemicals and fertilizer production, even minor equipment issues create chaos. A pump impeller wearing unevenly drops flow 5%, forcing downstream reactors & agitators to compensate with higher temperatures or recycle rates—directly hitting throughput and energy efficiency. Compressor valve leaks trigger surges that destabilize pressure profiles, while reactor agitator faults alter mixing and residence times, compromising product grade.

    Traditional approaches treat these as separate silos: pump mechanics here, process control there. The result? Reactive fixes after variability hits KPIs, with energy costs climbing as systems overcompensate.

    Reliability through prescriptive intelligence & analytics reframes this: one unified view of equipment + process data enables stable operations and measurable throughput gains.

    Why Predictive Tools Fail Process Industries02

    Plants generate rich data—pump discharge pressure, compressor interstage temps, reactor pH/vibration—but legacy predictive systems deliver generic alerts:


    “High vibration on Pump P-101”


    “Compressor surge detected”


    Process engineers & Energy managers are left guessing: Is this cavitation affecting reactor feed? Will it cascade to grade off-spec?


    This creates the classic outcome gap: insights exist, but without prescriptive actions tied to process impact—the result is a widening gap between data generated and decisions made.


    In high-stakes chemicals/fertilizer, where a single surge can mean batch rejection or safety shutdown, you need more than prediction—you need a closed-loop system: Equipment + Process Reliability that prescribes the fix and proves the throughput/energy win.

    PlantOS™ and the 99% Trust Loop 03

    PlantOS™—deployed across 844 plants including chemicals/fertilizer—uses vertical AI models
    trained on process industry failure modes to deliver 99.97% prediction accuracy. The 99%
    Trust Loop
    transforms data chaos into operator-validated reliability:

    1. Contextualize: Equipment + Process Data (Baselining Live in 2-3 Weeks)

    Ingests pump flow/pressure/vibration, compressor stage temps/surge signals, reactor agitator
    torque/pH—plus process KPIs (yield curves, recycle rates, grade specs)—calibrated to your
    plant in weeks.

    2. Observation & Diagnose: 99.97% Prediction Accuracy, Quantified Anomalies


    Pumps Compressor Agitator – Reactor

    Observation for Sulphuric Acid Circulation Pump – Chemical Plant

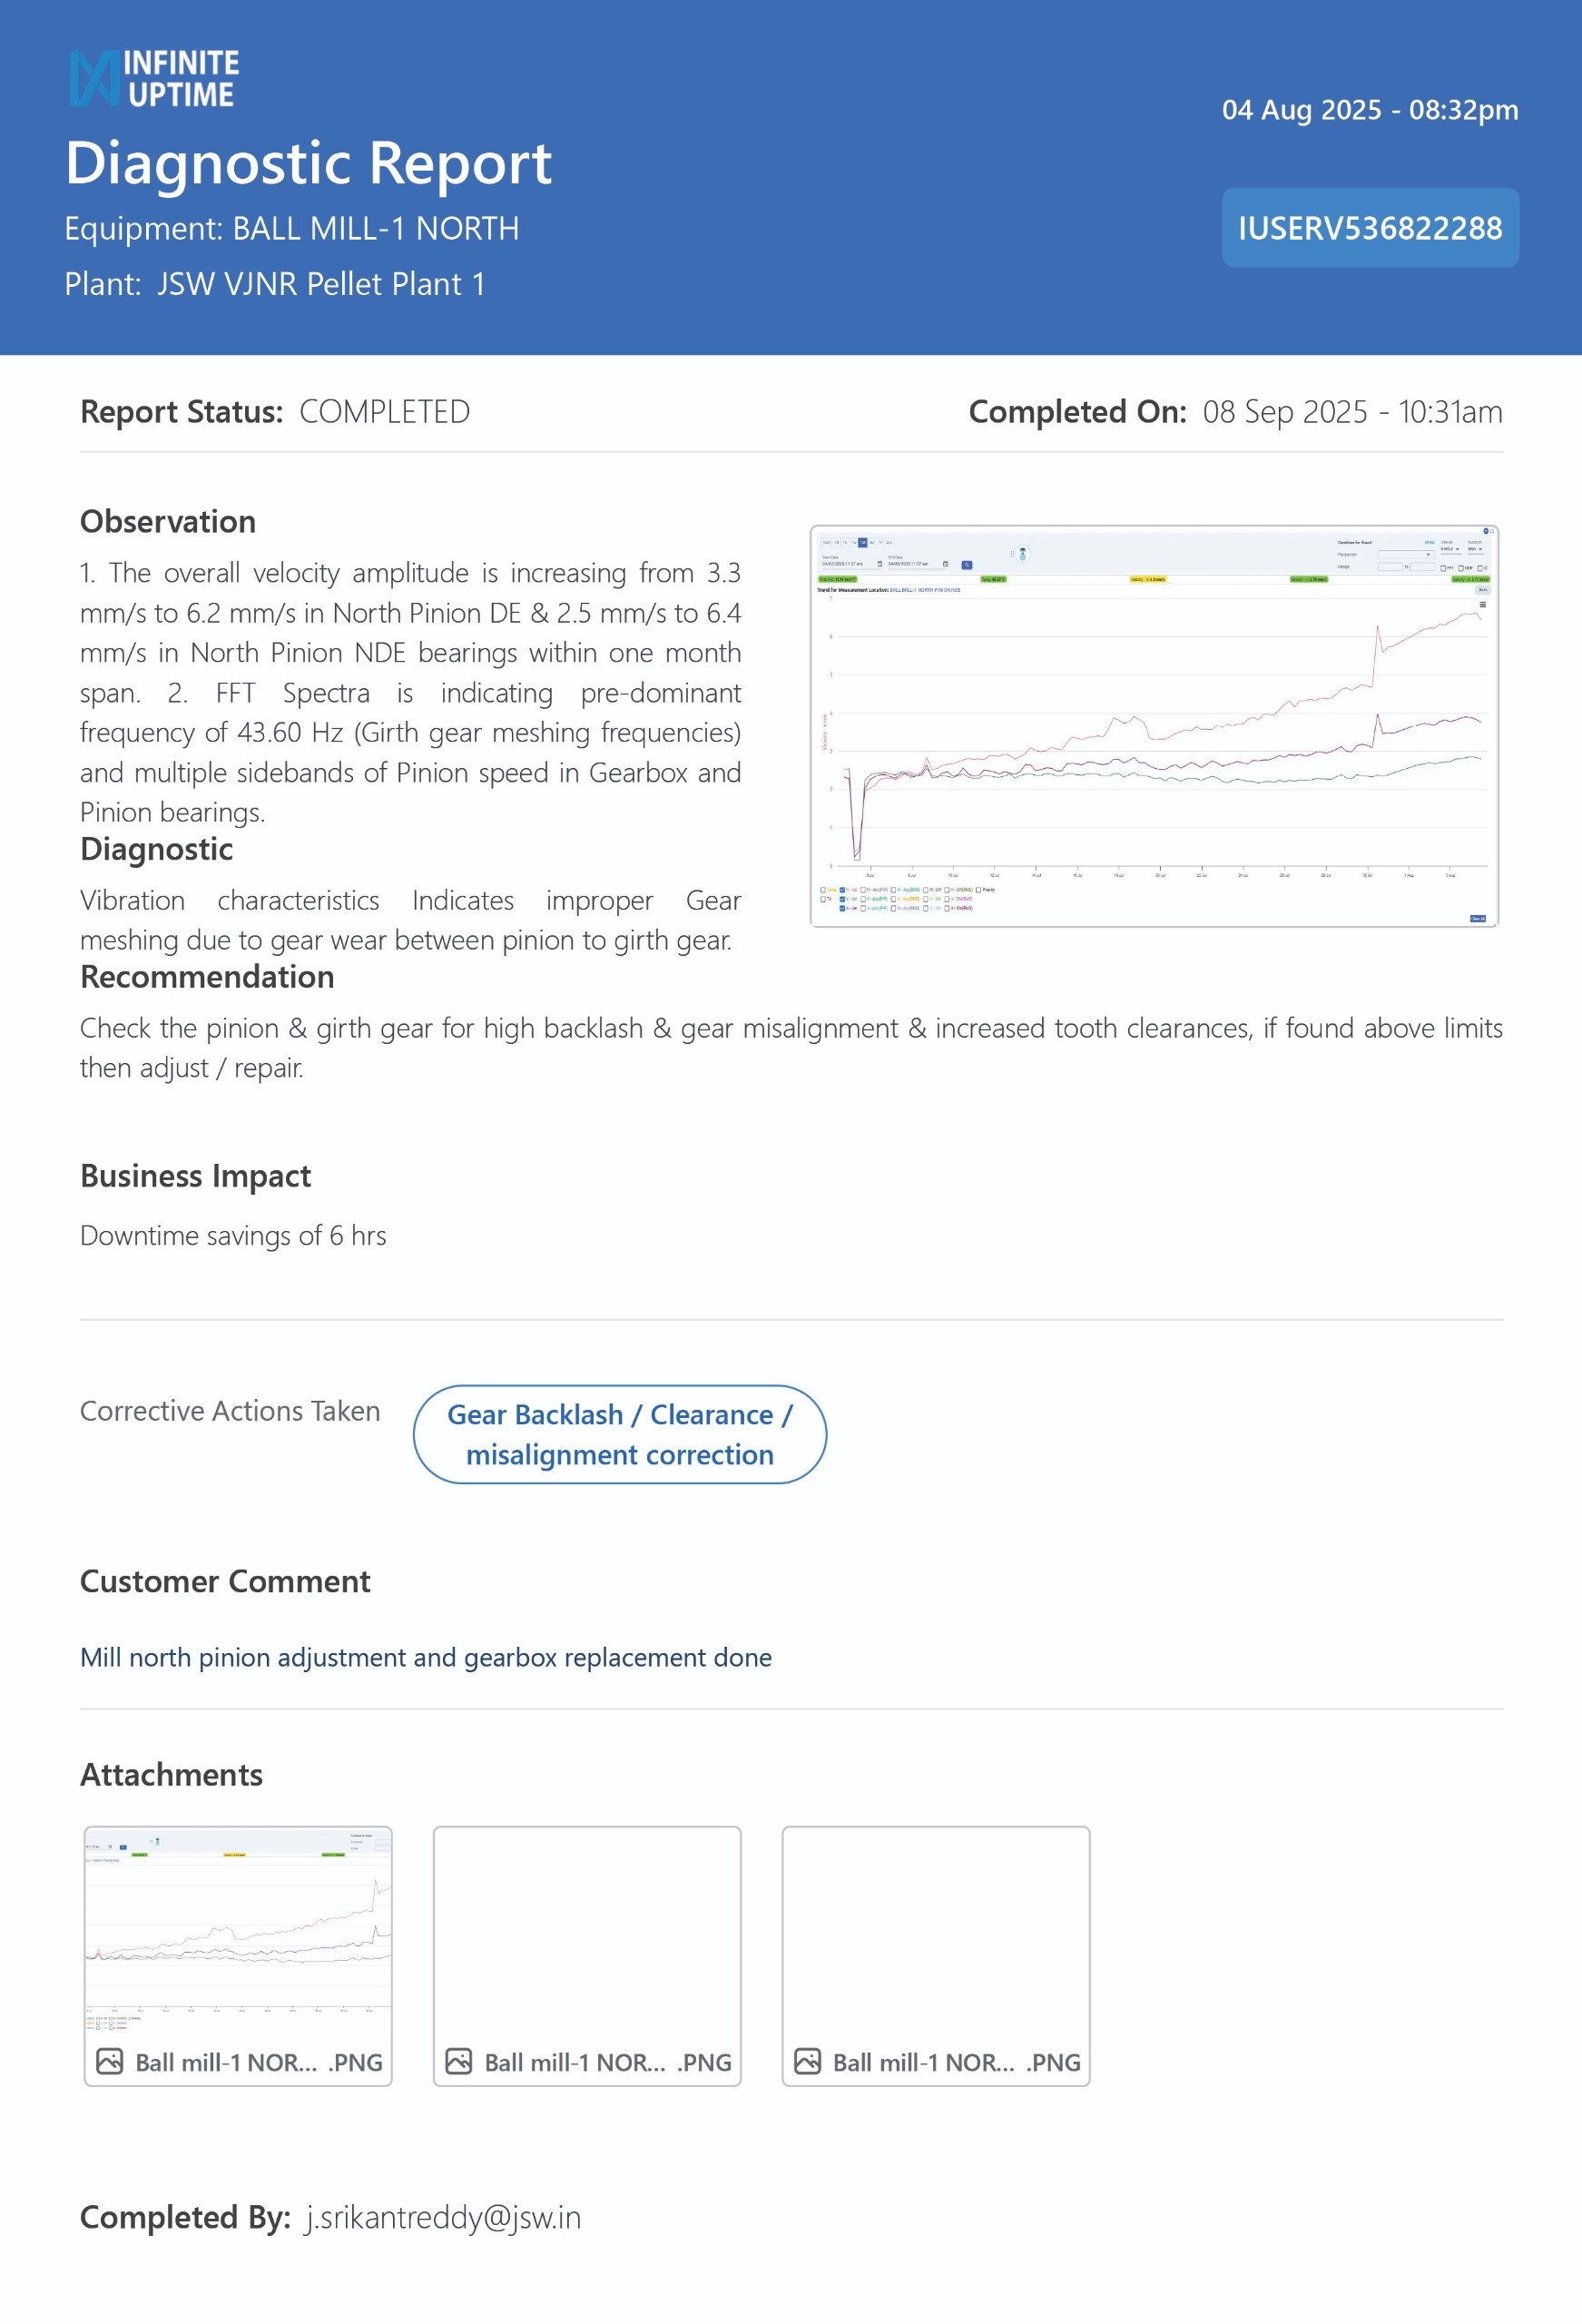
    Total acceleration value is increased from 14 to 142(m/s²)² at Pump DE (Drive End). Spectrum indicates bearing defect frequency of outer race at Pump DE.

    Diagnostic
    Vibration characteristics indicate bearing defect frequencies with respect to outer race raceway at Pump DE bearing (SKF 6209)

    Observation for Air Compressor – Fertilizer Plant

    The acceleration spectrum indicates a severe Beating Inner Race Fault, evidenced by prominent peaks near 1x, 3x, 9x, and 10x the calculated Ball pass frequency of Inner race (BPFI) across all axes, with very high amplitude levels observed.

    Diagnostic
    Bearing defect frequencies (BPFI) identified in spectra of motor DE bearings SKF 6319 M/c4VL

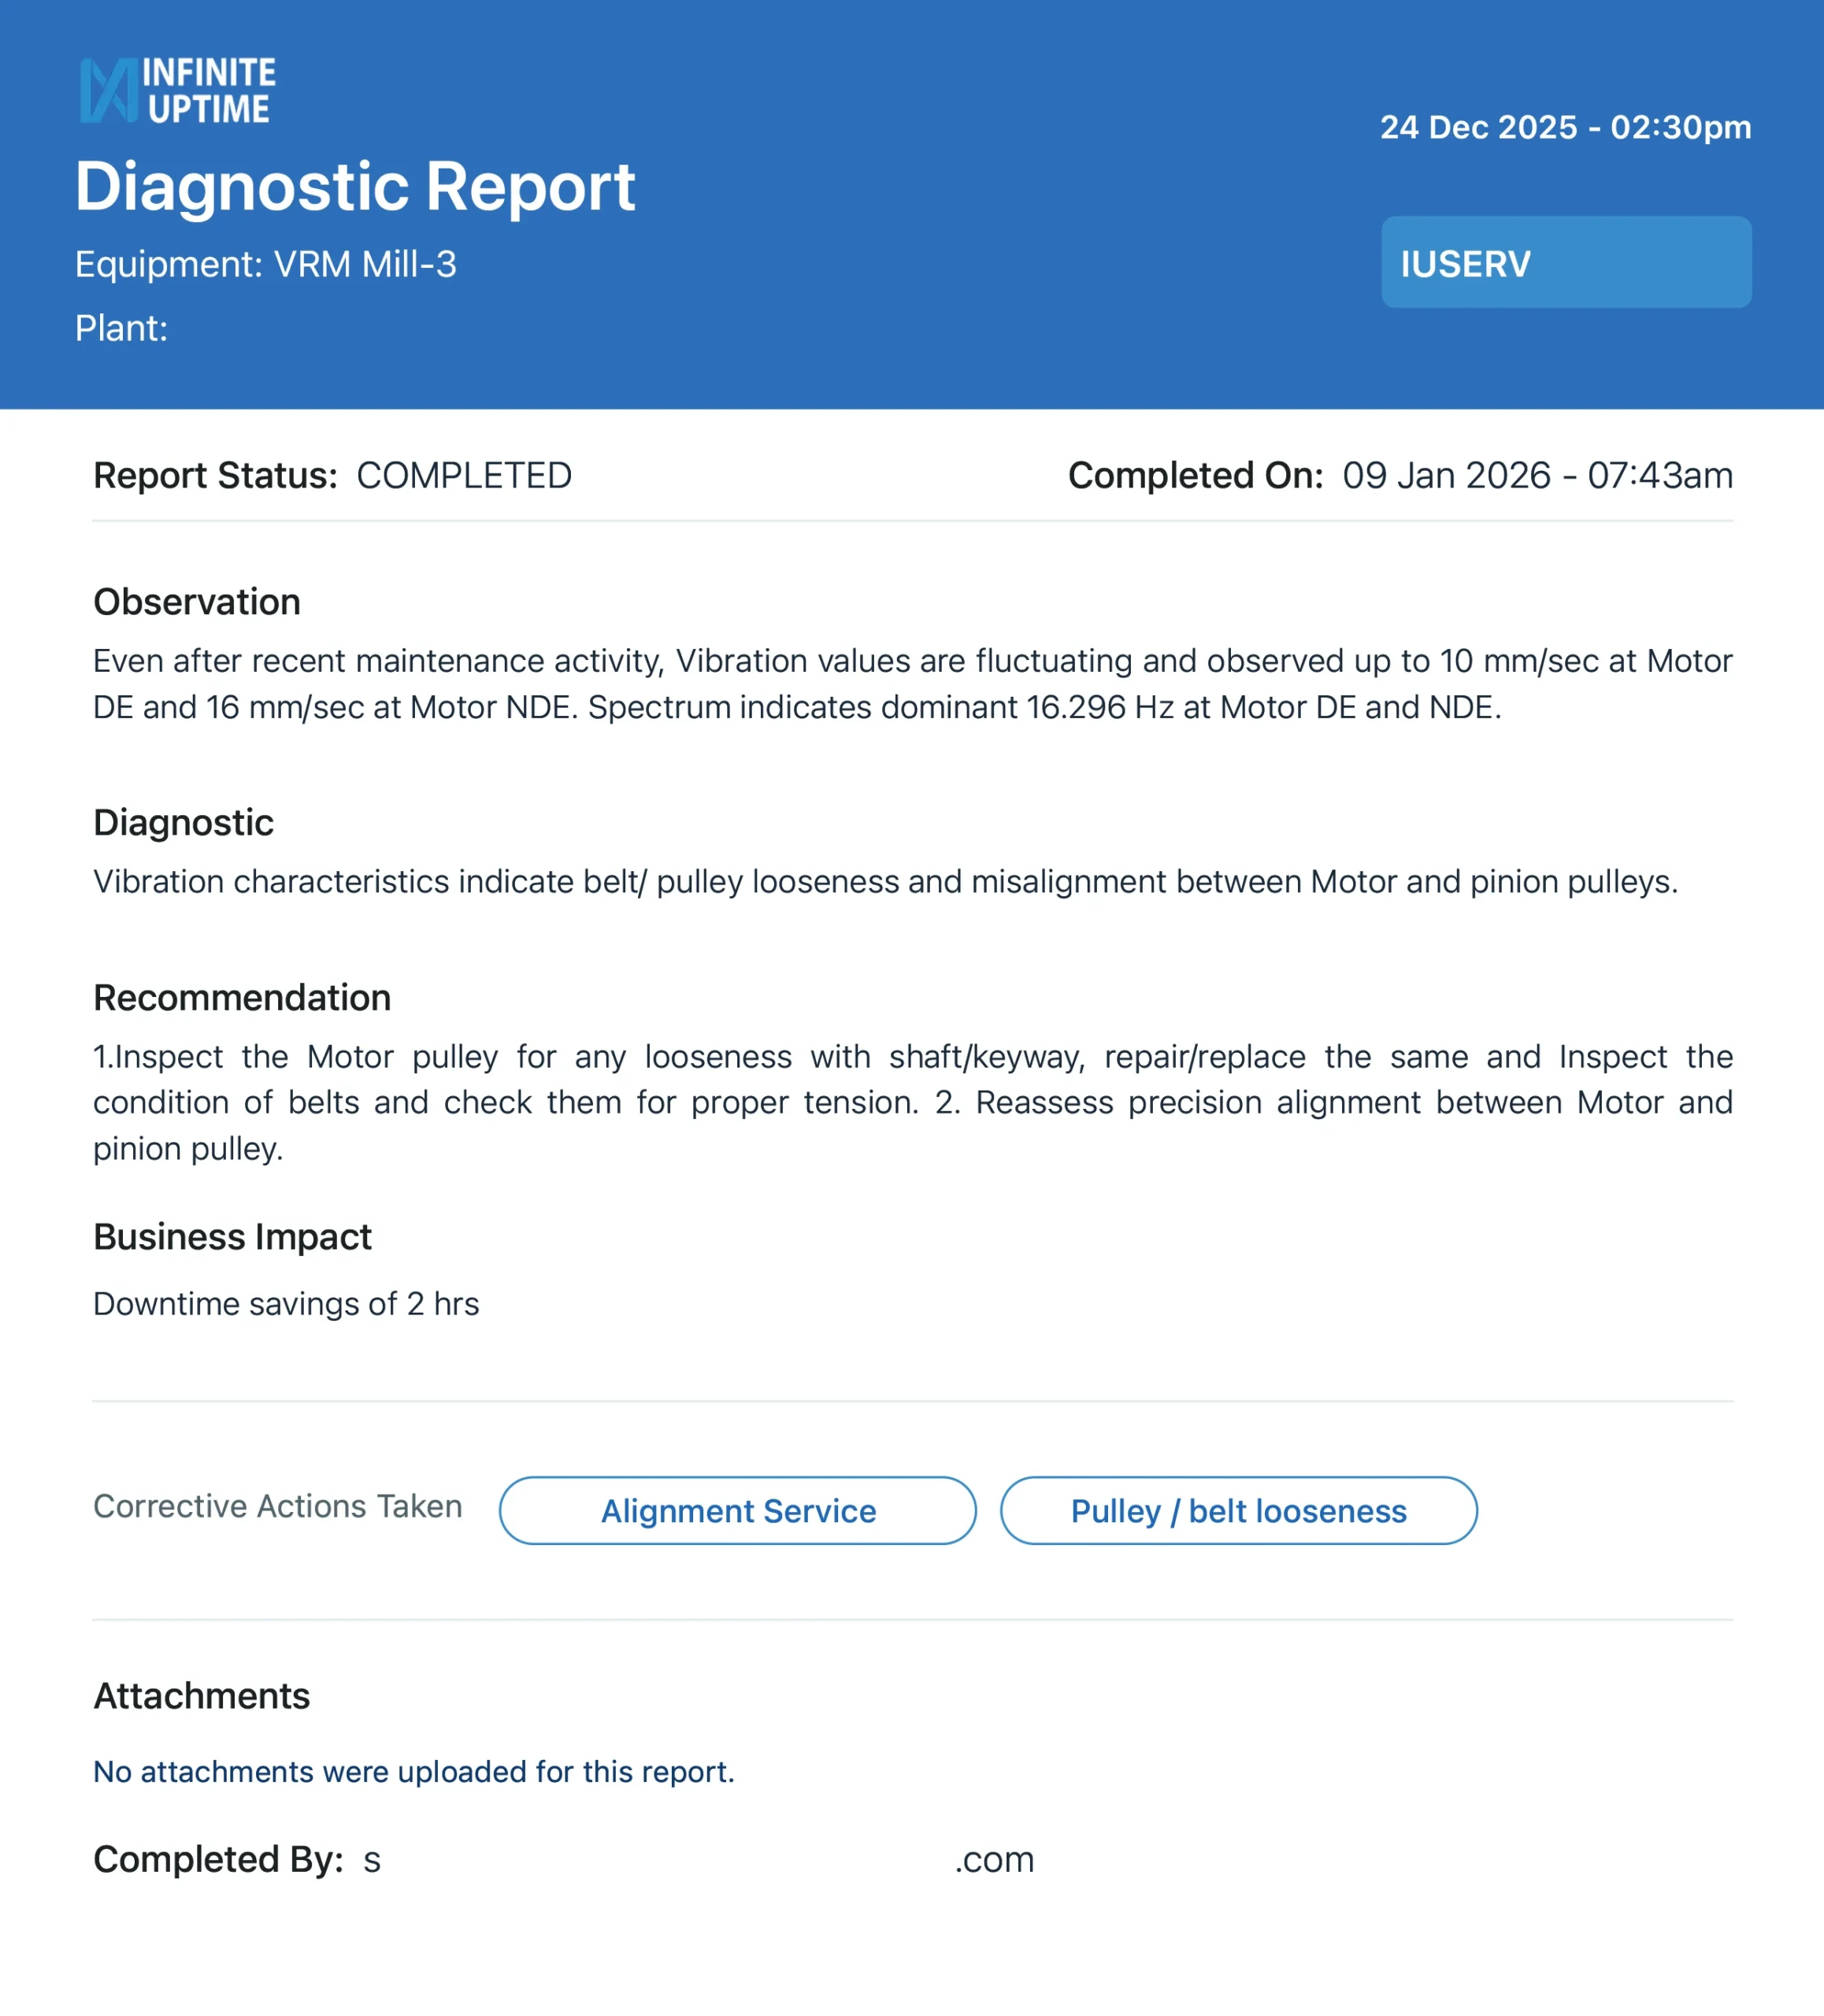
    Observation for Agitator – Chemical Plant

    Vibration value fluctuating and is observed up to max 9 mm/sec at Gearbox input DE (Drive End) and 6 mm/s at Motor DE. Spectrum indicates dominant 4x at Motor DE and gearbox input DE.

    Diagnostic
    Vibration characteristics indicate coupling defect and misalignment between Motor & Gearbox.


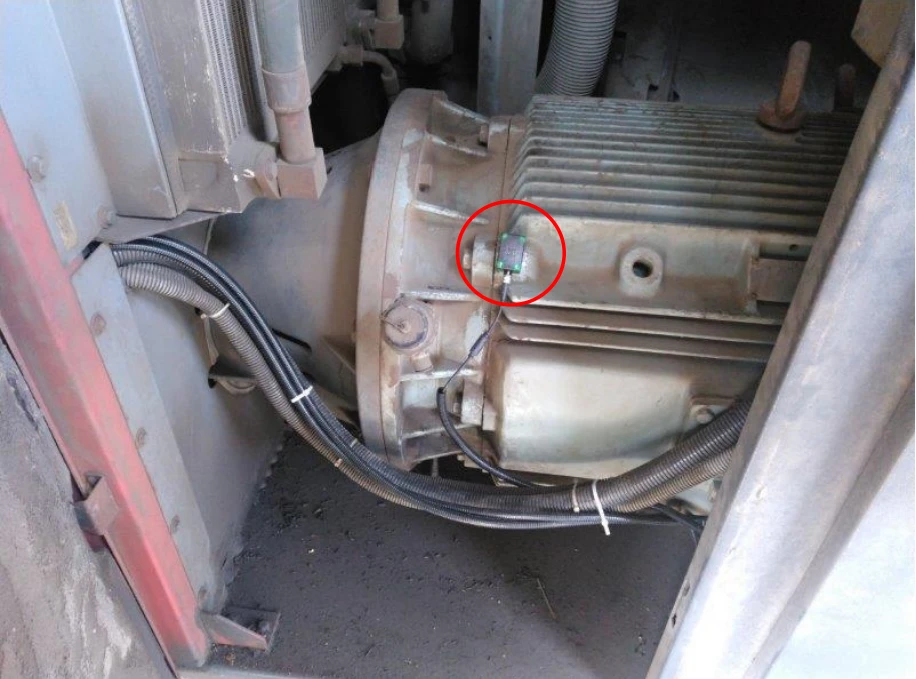
    compressor bearing fault detection using PlantOS AI in fertilizer plant agitator misalignment vibration analysis in chemical reactor pump cavitation monitoring using vibration sensor

    vEdge 3XTURPM deployed on the Drive End
    (DE) of motor – Acid Pump
    – live installation at
    a leading chemical/fertilizer manufacturer


    vEdge 3XTURPM sensor installed on motor drive end of high-power centrifugal compressor for vibration monitoring in chemical fertilizer plant

    vEdge 3XTURPM deployed on the Drive End
    (DE) of motor – High Power Centrifugal
    Compressor
    – live installation at a leading
    chemical/fertilizer manufacturer

    3. Prescribe: Structured ODR Reports

    Pumps Compressor Agitator – Reactor

    Recommendation for Sulphuric Acid Circulation Pump – Chemical Plant

    As a preliminary action, Re-lubricate the Pump bearing.
    At available opportunity, Replace the Pump bearing with respect to defects within raceway and rolling elements.

    Recommendation or Air Compressor – Fertilizer Plant

    In the next available opportunity, replace motor de bearing with respect to defects within inner raceway & rolling elements

    Recommendation for Agitator – Chemical Plant

    Inspect the coupling between motor and gearbox for defects like abnormal wear, excessive looseness, repair/replace the same.

    Reassess precision alignment between motor & gearbox

    4. Execute & Validate: Corrective Actions taken & Business Impact

    Pumps Compressor Agitator – Reactor
    Lubrication done & carried out bearing replacement

    Business Impact

    Downtime savings of 2 hrs

    Lubrication done

    Business Impact

    Downtime savings of 4 hrs


    High speed coupling lubrication & gearbox bearing lubrication done.
    Oil level checked and found normal

    Business Impact

    Downtime savings of 3 hrs

    PlantOS 99% Trust Loop infographic showing prescriptive AI delivering downtime reduction, energy efficiency, and throughput improvements For Pumps, Compressors, & Agitators, the 99% Trust Loop closes like this: raw sensor streams
    are contextualized by vertical AI models → a 99.97%-accurate fault prediction is generated → a
    specific, actionable prescription is delivered to the operator → the operator validates and
    executes → the outcome is tracked and fed back. A living reliability system, not a static rules
    engine.

    Pumps: From Cavitation Chaos to Flow Stability04

    Pre-scrubber pumps at India’s leading chemical manufacturer battle cavitation chaos in
    slurry service, where flow restrictions spiked DE (Drive End) bearing velocity from 2.1 to 6.4
    mm/s—123Hz vane pass dominance
    signalling strainer blockage or throttling that disrupts
    scrubber chemistry, forces reactor pressure swings, and burns energy on compensatory
    recycles.

    PlantOS™ flagged “DE velocity 6.4 mm/s (3x baseline); 123Hz confirms cavitation/flow
    restriction”,
    directing operators to check cavitation/strainer/valve issues.

    Momentary pump stop/start (operator note: “vibration normalized, flow related issue”)
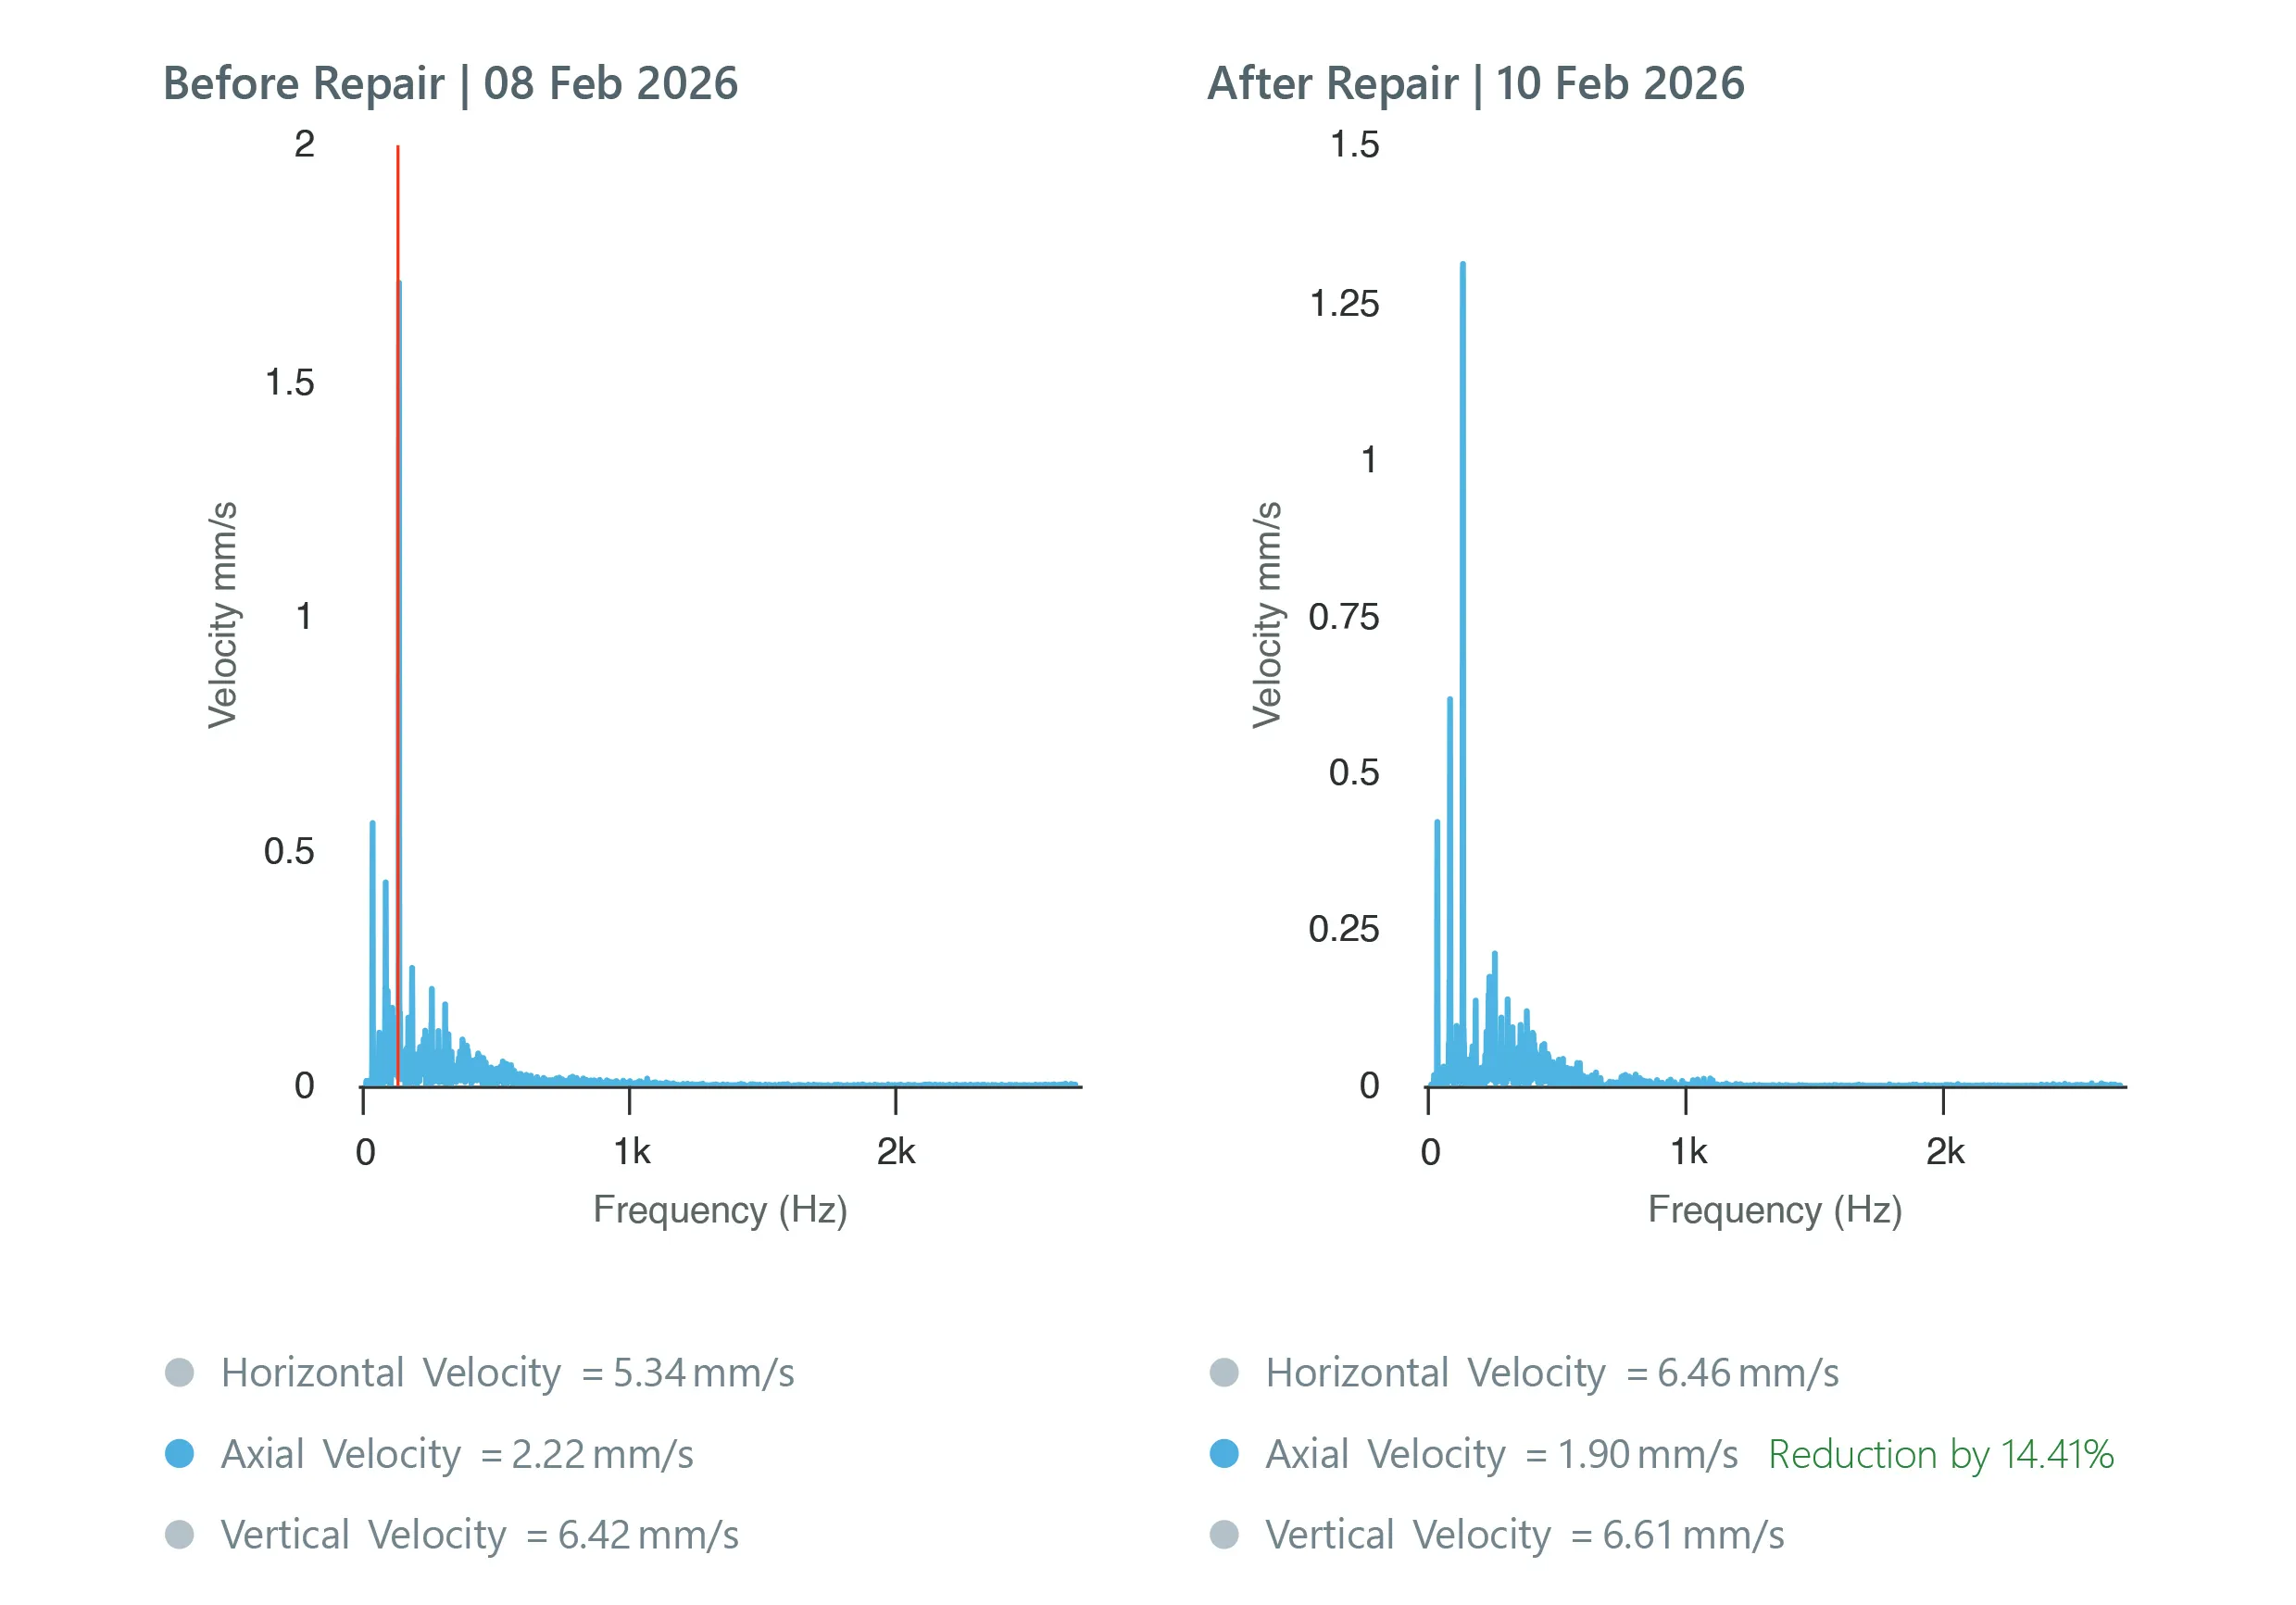
    delivered axial vibration velocity -14.41%, with trends snapping back to stability.


    Before and after vibration spectrum of chemical plant pre-scrubber pump showing reduced cavitation after corrective action

    Business impact: 4 hours
    downtime saved, cavitation-
    free scrubber flow
    → reactor stability → protected throughput, slashed recycle
    energy.

    Compressors: Surge Prevention, Pressure Predictability 05

    At India’s leading chemicals manufacturer, high-capacity centrifugal compressors
    handling synthesis gas service began showing a pattern PlantOS™ caught before operators
    noticed anything wrong.India’s leading chemicals manufacturer in synthesis gas service.

    PlantOS™ detected “Motor DE acceleration max 1186 (m/s²)² fluctuating; spectrum shows
    lubrication inadequacy”
    , prescribing DE bearing re-lubrication.

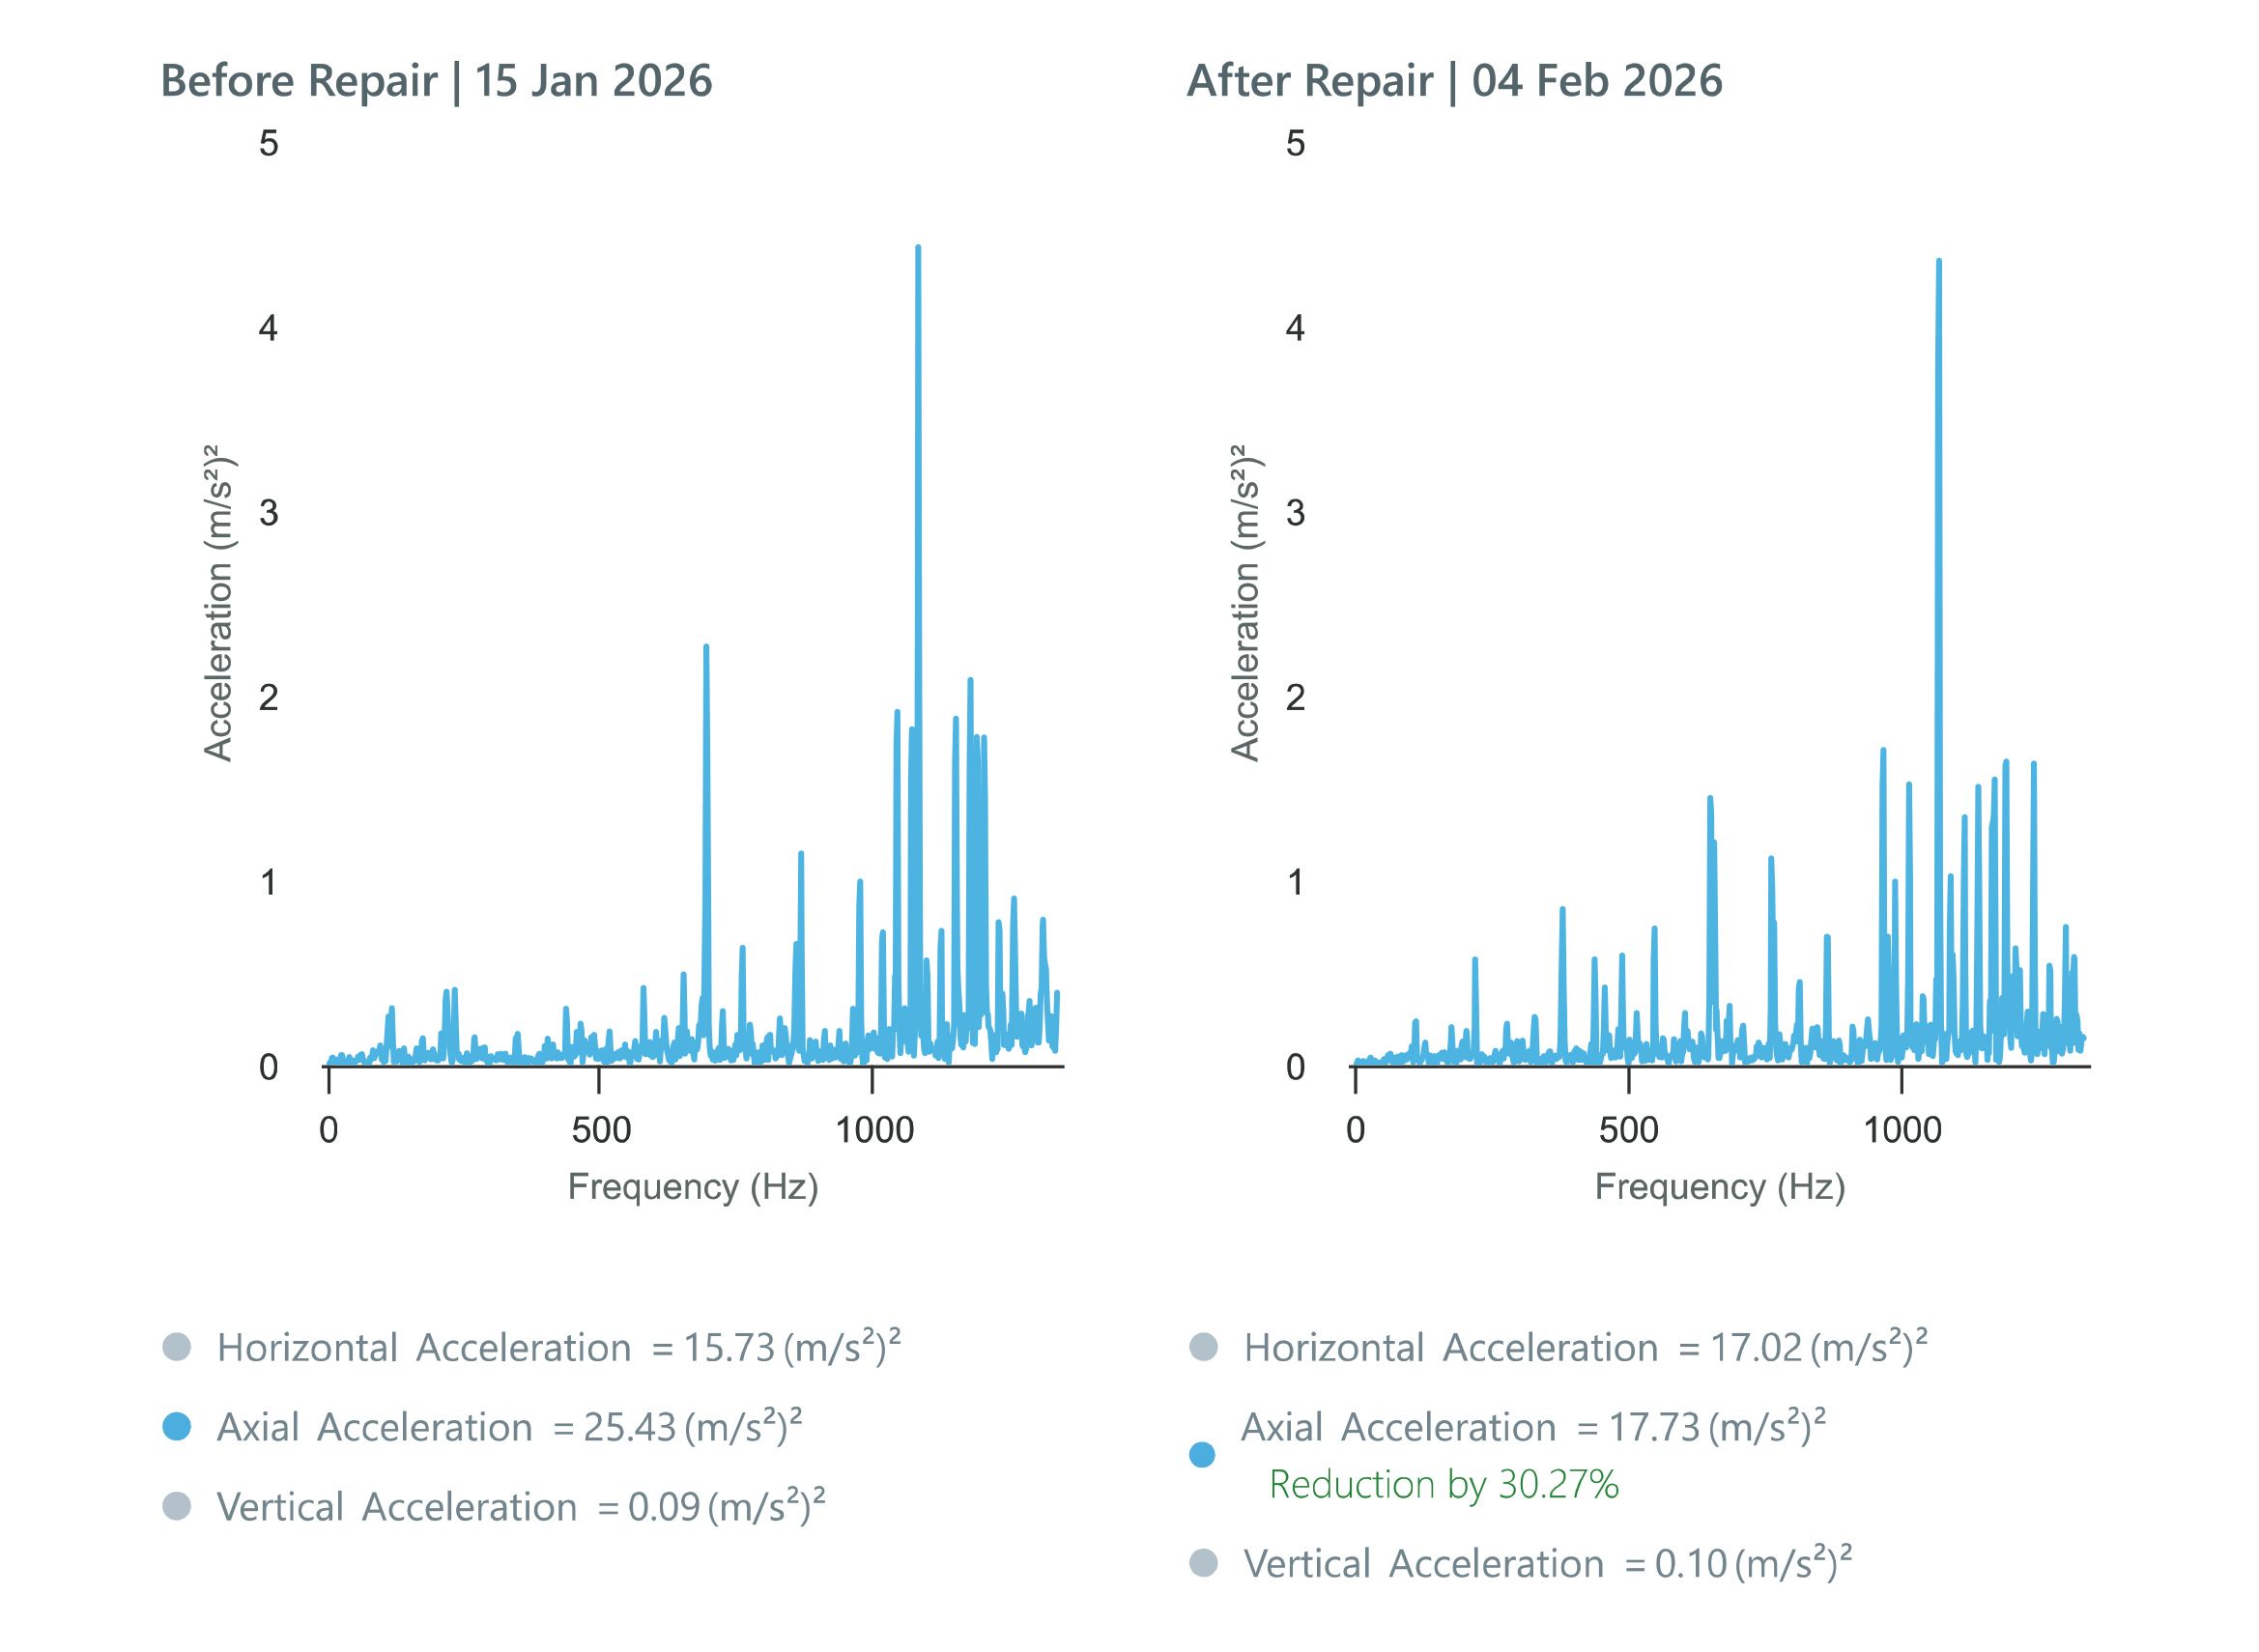
    Operators executed immediately (note: “Lubrication Done”), yielding axial acceleration –
    30.27%
    (25.43 → 17.73 (m/s²)², trends stabilized within 2 weeks.

    Business impact: 3 hours
    downtime saved
    , surge-free
    compression → stable reactor
    pressure
    , protected
    ammonia/urea throughput
    → optimized energy draw.


    Before and after vibration spectrum of centrifugal compressor motor showing reduced bearing acceleration after lubrication in chemical plant

    Agitators: Misalignment to Mixing Mastery 06

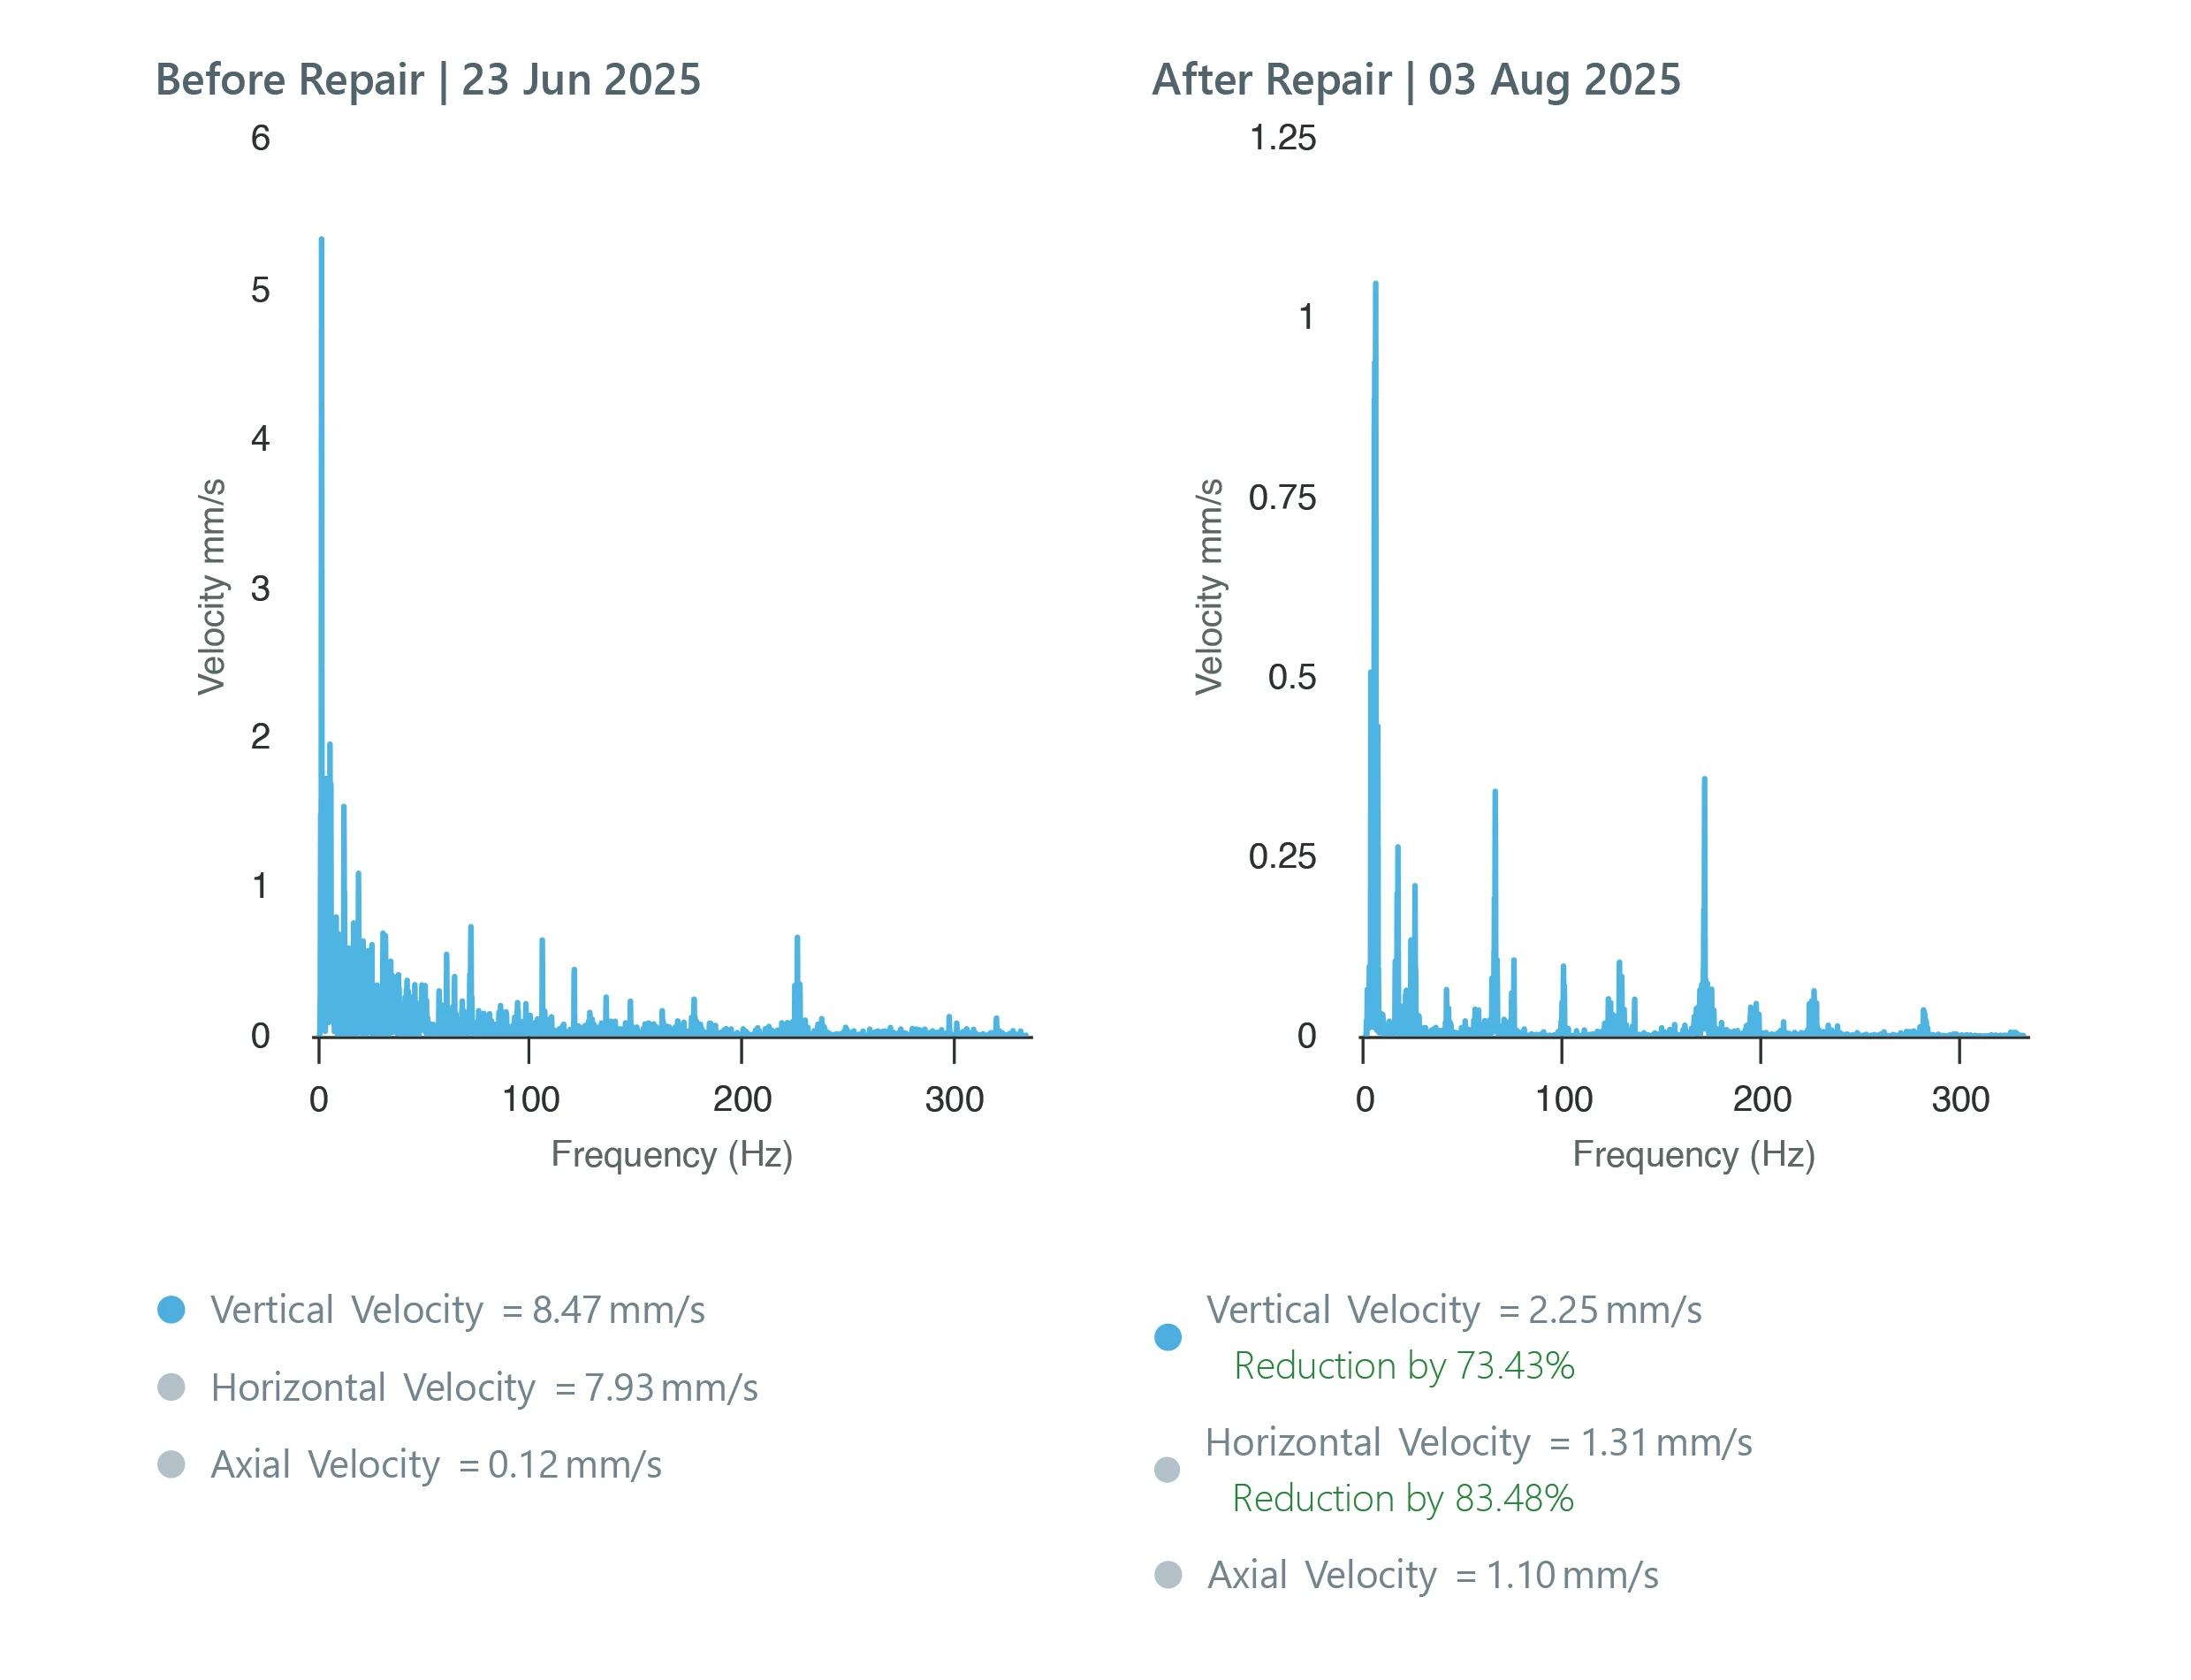
    Phosphoric Acid Plant agitators at a leading chemical manufacturer in UAE demand precision coupling in corrosive service, where misalignment generates dominant 1x (1.17 Hz) vibration—disrupting mixing uniformity, residence times, and reaction kinetics that cascade into grade off-spec, yield loss, and energy overuse for compensatory heating/stirring.


    Before and after vibration spectrum of phosphoric acid plant agitator showing reduced misalignment vibration after gearbox alignment

    PlantOS™ identified “Gearbox Output
    Drive End velocity spike: Vertical 8.47
    mm/s, Horizontal 7.93 mm/s; 1x
    harmonics confirm misalignment”
    ,
    prescribing precise alignment between
    gearbox output drive end and driven
    equipment
    .

    Operators executed alignment service +
    gearbox renewal (note: “gear box
    renewed”)
    , slashing: Vertical -73.43% (8.47
    → 2.25 mm/s), Horizontal -83.48% (7.93 →
    1.31 mm/s).
    Business im

    Business impact: 14 hours downtime
    saved, uniform mixing restored
    →
    consistent phosphoric acid grade → yield
    protection, optimized energy.

    What This Means for Plant Leadership 07

    For Energy Managers, Plant Head, and Reliability Engineering teams, Prescriptive AI-powered closed-loop reliability is now a strategic lever, not just a maintenance tactic.
    With PlantOS™ as the reliability intelligence layer for chemical and fertilizer operations, plants achieve:

    • Decisions operators execute: AI-assisted prescriptions replace guesswork with 99.97% prediction accuracy and 99%+ operator action rates.
    • Direct KPI linkage: Reliability actions measurably improve MTBF, MTTR, and kWh/ton — making production outcomes an operational reality.
    • Scalable across formulations/sites: One prescription, three outcomes (reliability/throughput/energy), total accountability—standardized ODRs for sulphuric acid pumps, syngas compressors, phosphoric agitators scale reactor-to reactor, plant-to-plant.
    • Proven, fast payback: 41 Chemical & Fertilizer plants. 4,138 downtime hours eliminated. 1,921 breakdowns avoided. Payback in 6–12 months, while peers are still waiting at month 18.

    The result is semi-autonomous operations: vertical AI handles diagnostics and prescriptions, freeing experts for strategic oversight—AI prescribes, operators validate—safer, higher-yield, energy-efficient plants.

    Frequently Asked Questions


    How does PlantOS™ Prescriptive AI outperform traditional predictive maintenance for chemical & fertilizer plants?

    Traditional predictive flags “high vibration” without process linkage. PlantOS™ delivers 99.97% accurate ODRs tying equipment to throughput:

    • Pre-scrubber Pump: “DE velocity 6.4 mm/s, 123Hz vane pass → cavitation/strainer check” → -14.41% axial vibration velocity, 4hr saved, stable reactor feed.

    • High-capacity Centrifugal Compressor: “Motor DE 1186 (m/s²)² lubrication fault → relubricate” → -30.27% axial acceleration, 3hr saved, surge-free pressure.

    • Phosphoric acid Agitator: “GB output DE 8.47 mm/s vertical, 1x 1.17 Hz misalignment → precise alignment” → -73% vertical acceleration, 14hr saved, uniform mixing.

    99% Trust Loop closes the gap between insight and action at a speed and scale traditional predictive tools cannot match. PlantOS™ doesn’t just flag faults—it closes the loop, validating every prescription against real outcomes. That’s what makes it a system operators trust and execute on, not another alert they ignore.

    NOTE- All ODR data from live PlantOS™ deployments at active chemicals/fertilizer plants


    Can PlantOS™ integrate with existing DCS/PLC systems in fertilizer plants without hardware replacement?

    Yes—PlantOS™ connects directly to DCS/PLC historians, ingesting pump discharge pressure, compressor interstage temps, reactor pH/torque, and process KPIs (yield, recycle rates). Plantspecific contextualization completes in 2-4 weeks, layering vertical AI models over your infrastructure. No rip/replace needed; vSense & vEdge (MEMS and Piezoelectric technology) sensors for blind spots. Deployed across 41 chemicals/fertilizer plants within the 844-plant footprint globally.

    See the outcomes for yourself.

    Read the world’s most user-validated Prescriptive AI case studies such as Coromandel— to explore how 41 chemical/fertilizer plants are driving outcomes with PlantOS™

    Thank you for your interest in PlantOS™ Prescriptive AI.

    Enter your official work email to unlock the World’s Most User-Validated Case Study.[contact-form-7 id=”e2b3932″ title=”pdf downlaod-blog-Prescriptive AI for Pumps, Compressors and Agitators”]

    Read More on Industrial Energy Efficiency

  • Prescriptive AI for Continuous Casting Cranes

    Prescriptive AI for Continuous Casting Cranes

    Prescriptive AI for Continuous Casting Cranes
    Enabling Semi-Autonomous Steel Mills

    Read Time: 8–9 minutes | Author – Kalyan Meduri

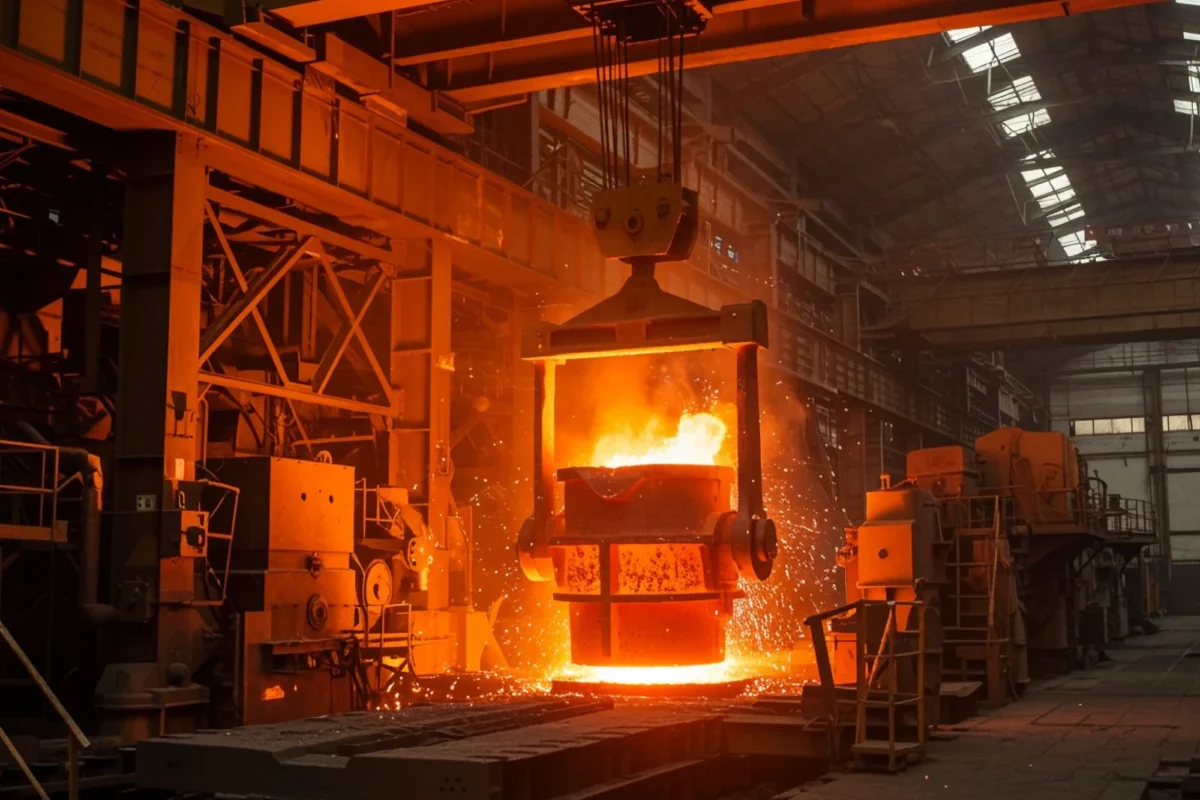
    An industrial overhead continuous casting crane lifting a heavy ladle filled with glowing, molten orange steel inside a manufacturing plant, illustrating prescriptive AI applications for steel industry equipment reliability.

    Key Highlights

    • How “green steel” goals are quietly derailed by reliability failures in continuous casting cranes and caster lines.
    • Why traditional predictive tools stall at alarms — leaving teams to guess the right action in high-risk, high-temperature environments.
    • How PlantOS™, powering the 99% Trust Loop, turns streaming sensor data into a single, trusted source of truth for prescriptive maintenance and energy-efficient operations.
    • What Prescriptive AI looks like on the shop floor: fewer breakdowns, higher throughput, lower kWh/ton — validated by operators, not dashboards.

    PlantOS™ Outcomes Footprint — As of November 2025
    Plants Digitalized
    across 9 verticals
    0
    Hours Eliminated
    globally (all verticals)
    0
    Steel Plants
    digitalized
    0
    Steel Hours
    downtime eliminated
    0
    Payback
    vs 18-24 months industry average
    6-12 Mo

    844 plants across 9 industrial verticals globally. Steel vertical: 226 plants, 53,208 hours eliminated, 15,255 breakdowns avoided.
    Payback: PlantOS™6–12 months vs. typical digital projects 18–24 months.

    Prescriptive AI for Continuous Casting Cranes

    Green steel is no longer a buzzword — it is a boardroom mandate. Regulators, investors, and customers are pushing steelmakers to decarbonize fast while remaining cost-competitive. But behind every sustainability roadmap lies an inconvenient truth: you cannot claim to be green if your most critical assets are unreliable, energy-hungry, and prone to disruptive breakdowns.


    Reliability is the foundation of green steel. Stable, uninterrupted casting operations enable up to 2% reductions in energy consumption per ton through optimized thermal management and consistent casting sequences. In an integrated steel plant, the continuous casting crane and caster line sit at this fragile intersection of reliability, safety, throughput, and energy intensity.


    When a crane failure delays ladle movement, or a breakout forces an emergency stoppage, energy, materials, and time are lost in one expensive cascade. That is exactly where Prescriptive AI — and PlantOS™’s 99% Trust Loop — change the script.

    Across 844 plants and 9 industrial verticals, PlantOS™ has eliminated 115,704 hours of unplanned downtime. Within the steel vertical alone — 226 plants — the figure stands at 53,208 hours, with 15,255 breakdowns avoided and a 6–12-month payback against an industry norm of 18–24.

    The Green Steel Mandate Meets Casting Reality 01

    Consider a continuous casting crane unavailable during peak sequence timing. Ladle handling delays cascade into extended thermal hold times, sub-optimal heat scheduling, and higher kWh/ton as reheating compensates for idle losses. A caster breakdown compounds this — scrapped steel, damaged segments, emergency interventions — all driving energy inefficiency that directly undermines green steel targets.

    Green steel succeeds when reliability enables energy efficiency — not as a side effect, but as a concrete P&L lever with measurable energy savings per ton produced.

    Why Traditional Predictive Tools Stall at Alarms 02

    Most plants today are not short of data. Vibration sensors on crane gearboxes, temperature monitoring on motors, torque and brake feedback, plus caster measurements like mould level, oscillation, segment temperature, and hydraulic pressures are all streaming somewhere. Traditional predictive tools do a decent job of turning raw signals into alerts:


    • “Crane gearbox vibration trending above threshold.”

    • “Segment hydraulic pressure unstable.”

    • “Abnormal mould temperature pattern — risk of shell thinning.”


    The problem is what happens next.

    In many cases, these tools leave engineers with a red or yellow signal and a generic recommendation: “Inspect asset,” “Plan maintenance,” or “Check lubrication.” In a high-pressure casting bay, that is not enough. The result:


    • Alarm fatigue: too many alerts with too little context.

    • Low trust: operators remember every false alarm, not the saves.

    • Outcome gap: insights exist, but they do not reliably translate into timely, precise, executed actions.


    You remain in a world of predictive signals without a prescriptive path to prevent the next crane stoppage or caster breakout with confidence.

    PlantOS™ and the 99% Trust Loop 03

    PlantOS™ — the world’s most user-validated Prescriptive AI — was built to close this outcome gap, not to produce more dashboards. Its vertical AI models are trained on industry-specific failure modes across metals, mining, cement, paper, chemicals, and other asset-intensive sectors, delivering highly contextual machine diagnoses rather than generic “high vibration” flags.


    At the heart of the platform is the 99% Trust Loop — a closed loop combining fault prediction, prescriptive recommendations, operator validation, and outcome tracking. PlantOS™ operates across 844 plants and 9 industrial verticals globally, eliminating 115,704 hours of unplanned downtime. Within the steel vertical — 226 plants — outcomes are:


    • 99% of recommended actions acted upon by operators

    • 53,208 hours of unplanned downtime eliminated — user-validated

    • 15,255 breakdowns avoided across steel plant equipment categories

    • 6–12-months payback — versus the 18–24 months typical of digital transformation projects

    PlantOS 99% Trust Loop infographic showing prescriptive AI delivering downtime reduction, energy efficiency, and throughput improvements

    For a continuous casting crane and caster line, the Trust Loop closes like this: raw sensor streams are contextualized by vertical AI models → a 99.97%-accurate fault prediction is generated → a specific, actionable prescription is delivered to the operator → the operator validates and executes → the outcome is tracked and fed back. A living reliability system, not a static rules engine.
    Continuous Casting Crane — From Critical
    Risk to Controlled Variable
    04

    Cranes in a casting bay live a hard life: heavy loads, heat, dust, and constant starts and stops. Even minor electrical or mechanical failures can halt crane operation and bring casting to an abrupt stop. Within PlantOS™’s verified steel outcomes, gearboxes alone account for 1,592 units monitored, with 5,692 downtime hours saved and 1,059 actions prescribed accurately — making crane-class equipment one of the highest-leverage intervention points in the plant.


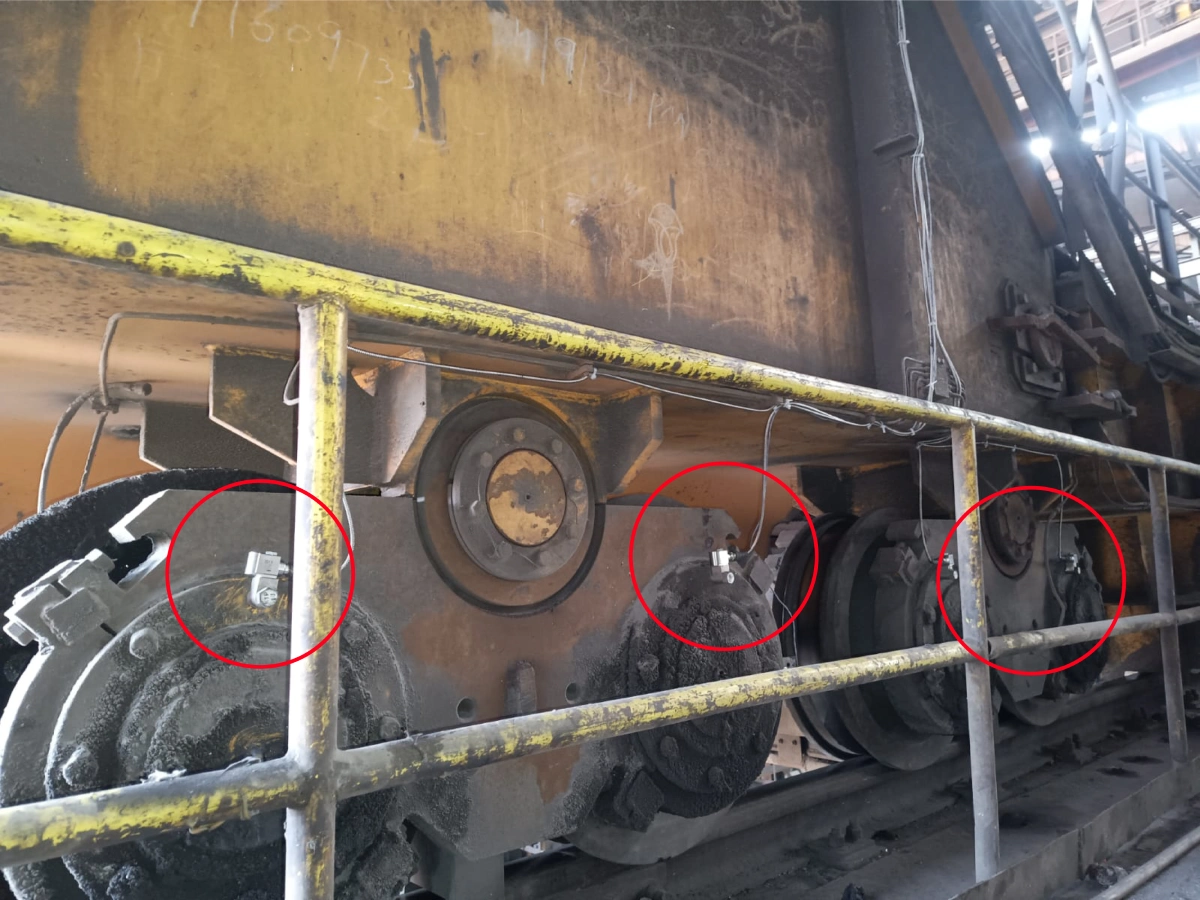
    vSense 1XT deployed on the wheels of a Casting Crane – live installation at a leading global steel manufacturer
    PlantOS Digital Reporting System — User-Validated True Positives — August 2025

    vSense 1XT deployed on the wheels of a Casting Crane – live installation at a leading global steel manufacturer


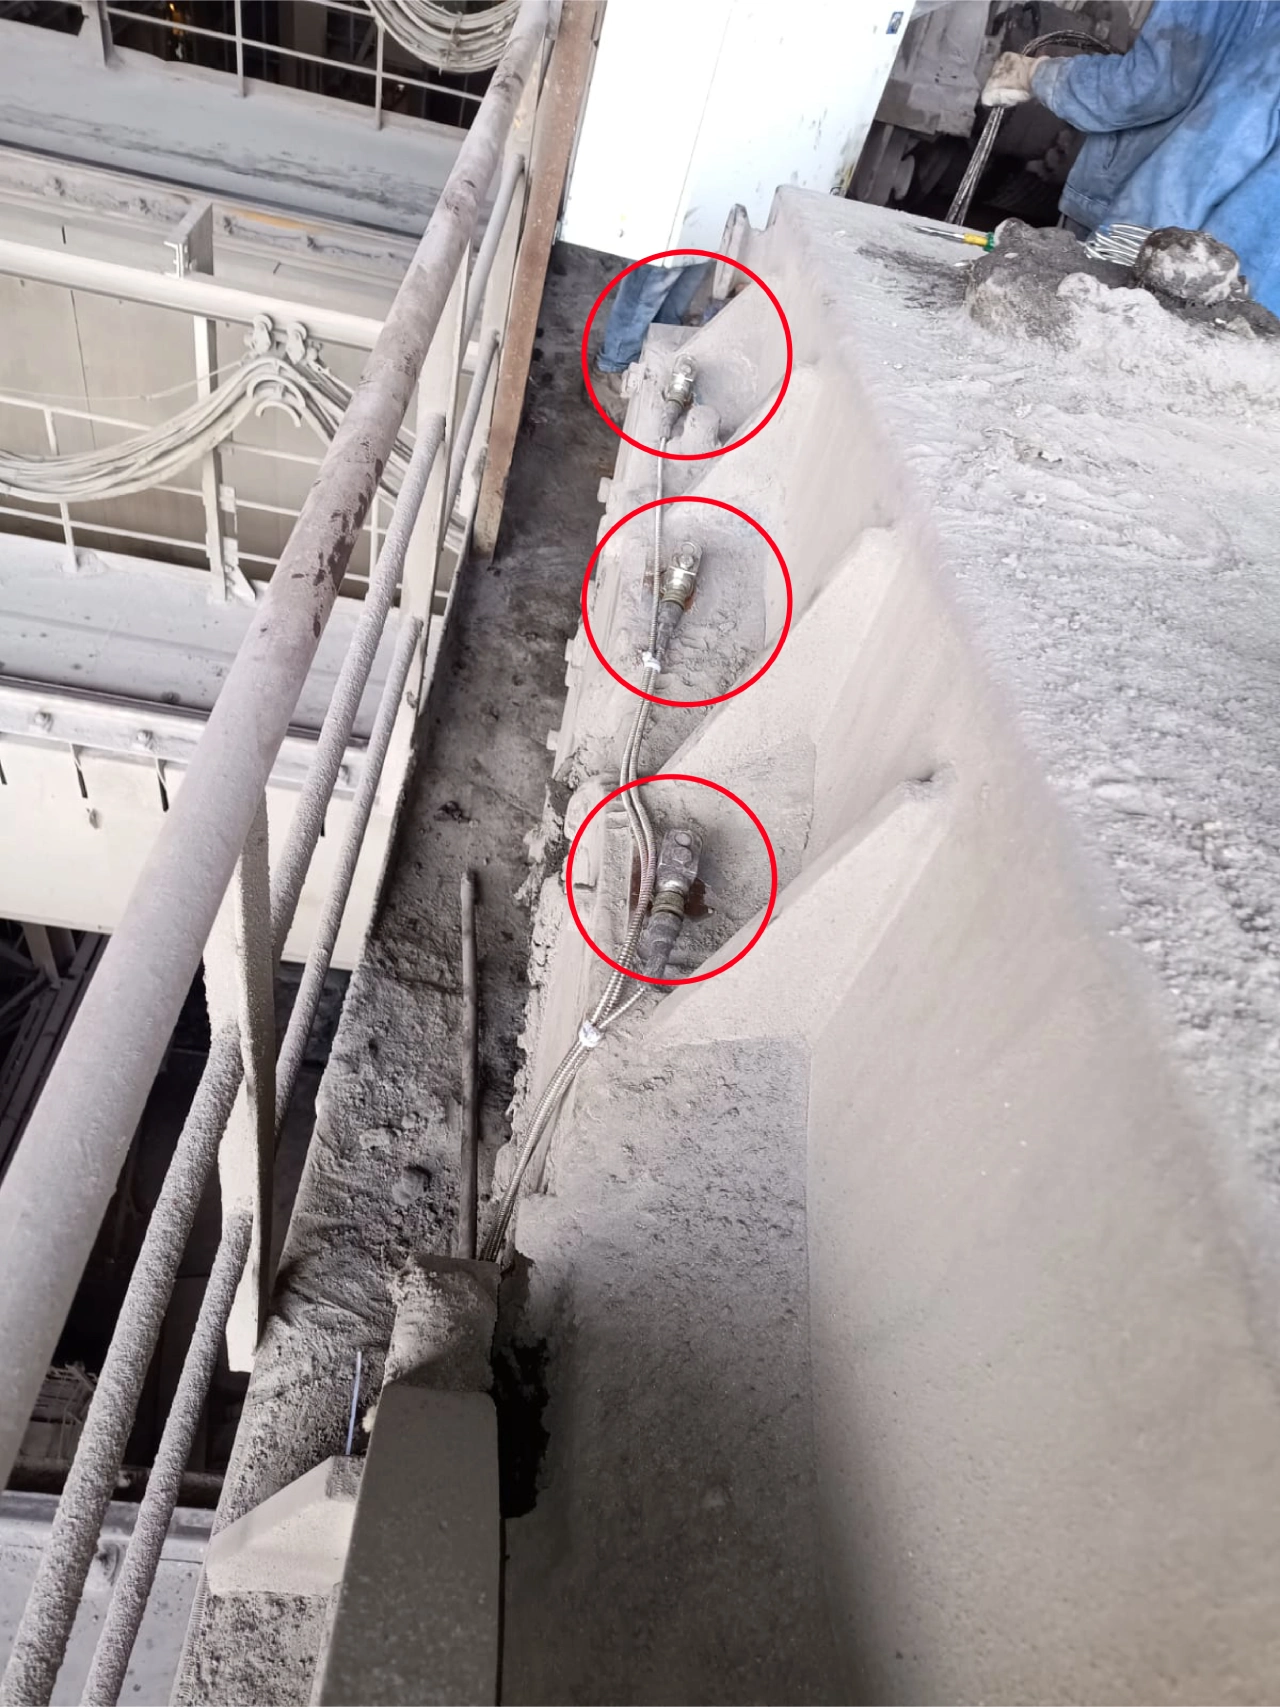
    vSense 1XT deployed on the Gearbox Non-Drive End of a Casting Crane- live installation at a leading global steel manufacturer.

    Proximity Sensor installed on the Gearbox Output of a Casting Crane live deployment at a leading global steel manufacturer.


    Proximity Sensor installed on the Gearbox Output of a Casting Crane live deployment at a leading global steel manufacturer.

    vSense 1XT deployed on the Gearbox Non-Drive End of a Casting Crane– live installation at a leading global steel manufacturer.

    Prescriptive AI on PlantOS™ reframes crane reliability around three core questions:

    1. Can we see failures earlier, with context?

    By combining vibration, temperature, acoustic, magnetic flux, torque, brake status, and duty cycle data, PlantOS™ distinguishes between overload, alignment issues, bearing degradation, and control problems — not just “high vibration.”

    2. Can we recommend the right action at the right time?

    PlantOS™ generates a detailed Observation Diagnostic Recommendation (ODR) report — a concise, shop-floor-ready document that specifies:


    A technical document featuring two blue line graphs plotting Velocity (mm/s) against Frequency (Hz). The left graph, dated March 2024, shows higher vibration peaks. The right graph, dated November 2024, shows a flatter profile. Text below highlights a 9.16% reduction in velocity and includes a note that lubrication was completed.
    PlantOS Digital Reporting System — User-Validated True Positives — August 2025
    • The precise Fault Diagnosis:
      “Amplitude in Total Acceleration is higher in wheel bearing 12 [>400 (m/s²)²]
      compared to other wheel bearings.
      Vibration characteristics indicate bearing defects at wheel bearing 12.”
    • The Recommended Action:
      “Relubricate Wheel Bearing 12 as a
      preliminary action. Inspect LT Wheel
      Bearing 12 for defects at the next
      available opportunity.”
    • Expected Outcome:
      The expected outcome: “Downtime
      savings of 3 hours.”

    3. Can we prove it worked?

    Every prescription is tied to a tracked
    outcome: downtime avoided, throughput
    maintained, or a crane failure safely shifted into a planned shutdown window. This creates auditable, data-backed reliability KPIs that plant leadership can trust — and report.Over time, the crane shifts from a brittle, failure-prone point of anxiety to a controlled variable in the plant’s production outcomes equation.

    Steel Plant Equipment Outcomes — PlantOS™ Verified Data 05

    The following figures reflect user-validated outcomes across PlantOS™’s 226-plant steel footprint. Equipment marked † maps directly to continuous casting crane and caster line components discussed in this article.

    Equipment Category Units Downtime
    Hours Saved
    Prescriptions
    Acted Upon
    Blower 1,540 18,100 4,219
    Gearbox † 1,592 5,692 1,059
    Crusher 51 1,042 226
    Conveyor 110 544 125
    Rope Drum † 12 184 46
    Mill Dryer 19 129 20
    Cylinder 7 79 13
    Vibroscreen 4 79 15
    Roll † 1 44 21

    † Gearbox, Rope Drum, and Roll are directly applicable to crane and caster line reliability.

    Source: PlantOS™ Digital Reporting System — User-Validated True Positives, November 2025.

    Preventing Caster Breakdowns — Equipment and Process
    Reliability as
    One 06

    Caster breakdowns rank among the most disruptive events in a continuous casting shop, triggered by mould oscillation drift, segment hydraulic failures, roll wear, and ladle/crane timing issues. Traditional approaches silo these subsystems — mould here, hydraulics there, crane elsewhere — creating diagnostic blind spots that prescriptive AI eliminates.


    PlantOS™ delivers Equipment + Process Reliability as a single source of truth by correlating:


    • Equipment Data: Mould oscillation, segment hydraulic pressures, crane wheel bearing acceleration, roll vibration.


    • Process Data: Mould level, shell growth rates, ladle thermal profiles, sequence timing.


    Rather than surfacing a hydraulic anomaly in isolation, PlantOS™ evaluates it in the context of sequence timing, crane availability, and ladle temperature — and recommends action that addresses the system, not just the component.

    Energy Efficiency — Every Avoided Fault Is Dual-Purpose07

    In steelmaking, where energy costs dominate the P&L, every minute of unstable casting taxes your kWh/ton. Electrical faults (crane hoist motor overloads), mechanical failures (wheel bearing spalling), and process anomalies (mould oscillation drift) create cascading thermal losses — inefficient ladle and tundish holding, sub-optimal EAF or BOF operation, and reheating penalties.


    PlantOS™ stabilizes crane and caster reliability by catching these faults early and prescribing corrective action before thermal losses compound:


    • Smoother sequences: Fewer interruptions mean better thermal management and less energy wasted holding or reheating material.


    • Higher throughput per energy block: More tons produced within the same scheduled energy window, improving effective energy intensity.


    • Validated gains: Prescriptive maintenance via the 99% Trust Loop has delivered up to 2% energy reduction per ton in real-world deployments, alongside 53,208 hours of steel downtime eliminated.

    Every avoided crane fault or caster anomaly is dual-purpose: reliability and throughput gains that make green steel claims operationally credible and financially defensible.

    What This Means for Plant Leadership 08

    For COO, Plant Head, and Reliability Engineering teams, Prescriptive AI-powered closed-loop reliability is now a strategic lever, not just a maintenance tactic.


    With PlantOS™ as the single source of truth for continuous casting operations, plants achieve:


    • Decisions operators execute: AI-assisted prescriptions replace guesswork with 99.97% prediction accuracy and 99%+ operator action rates.


    • Direct KPI linkage: Reliability actions measurably improve MTBF, MTTR, and kWh/ton — making production outcomes an operational reality.


    • Scalable reliability playbook: One prescription, three outcomes, zero guesswork. Standardized ODR templates, thresholds, and parts lists across casting lines, plant sites, and steel grades — eliminating site-to-site variation.


    • Proven, fast payback: 226 steel plants. 53,208 downtime hours eliminated. 15,255 breakdowns avoided. Payback in 6–12 months, while peers are still waiting at month 18.


    This enables semi-autonomous operations where vertical AI handles diagnostics and prescriptions, freeing experts for strategic oversight — delivering safer, more profitable, and greener steel production.

    Frequently Asked Questions


    How is Prescriptive AI different from predictive maintenance on our casting crane?

    Predictive maintenance flags that a component may fail soon but rarely tells you exactly what to do, when, and with what expected impact. Prescriptive AI on PlantOS™ goes further — recommending specific, time-bound actions and learning from operator feedback, driving 99%+ action rates. The ODR report gives your team a step-by-step intervention, not an alert to interpret.


    Can PlantOS™ work with our existing sensors and control systems?

    Yes. PlantOS™ ingests data from existing condition monitoring systems, PLCs, historians, and sensors on cranes, casters, and auxiliary equipment. It layers vertical AI models and the 99% Trust Loop on top — without forcing a rip-and-replace hardware strategy.


    How does this support our green steel and decarbonization targets?

    By reducing unplanned stoppages, breakouts, and crane-related delays, PlantOS™ helps you produce more tons within the same or lower energy envelope, improving kWh/ton and associated emissions intensity. These improvements are operator-validated and auditable — credible inputs into green steel reporting and customer commitments.


    What kind of results have steel plants seen with the 99% Trust Loop?

    Across PlantOS™’s 226 steel plants: 53,208 hours of unplanned downtime eliminated, 15,255 breakdowns avoided, payback in 6–12 months — all user-validated. These steelspecific outcomes sit within a broader global footprint of 844 plants and 9 verticals, where PlantOS™ has collectively eliminated 115,704 downtime hours. For steelmakers, this translates into fewer breakouts, higher continuous caster availability, and more stable, energy-efficient operations that support both P&L and green steel commitments.

    See the outcomes for yourself.

    Read the world’s most user-validated Prescriptive AI case study — JSW Steel — and explore how 226 steel plants are running smarter with PlantOS™.

    Thank you for your interest in PlantOS™ Prescriptive AI.

    Enter your official work email to unlock the World’s Most User-Validated Case Study.[contact-form-7 id=”fc0c82e” title=”pdf downlaod-blog-Prescriptive AI for Continuous Casting Cranes”]

    Read More on Industrial Energy Efficiency

  • The Energy Problem Plants Are Solving Wrong

    The Energy Problem Plants Are Solving Wrong

    The Energy Problem Plants Are Solving Wrong How Process Stability — Not Equipment Upgrades — Unlocks Industrial Energy Efficiency

    Read Time: 8–9 minutes | Author – Kalyan Meduri

    The Energy Problem Plants Are Solving Wrong How Process Stability — Not Equipment Upgrades — Unlocks Industrial Energy Efficiency

    Most industrial energy reduction programmes start in the wrong place. They audit equipment specifications. They upgrade motors. They install variable frequency drives. And then they wonder why the energy bills barely move.

    Here is what the equipment audit misses: a 2% deviation in operating parameters can increase energy consumption by 8–12% in rotating equipment. That deviation is not a hardware problem. It is a stability problem — and most plants have no reliable way to detect it until a motor fails, a kiln trips, or a compressor seizes.

    The real lever for industrial energy efficiency is not what your equipment is rated for. It is how consistently that equipment actually operates. And closing that gap — between rated efficiency and real-world efficiency — requires something most energy programmes are not designed to deliver: process stability at machine level.

    A 2% deviation in operating parameters can increase energy consumption by 8–12% in rotating equipment. Most plants have no way to detect it until failure.

    What Process Stability Actually Means (And What It Does Not)

    Process stability is not the same as process control. Control systems regulate setpoints. Stability describes whether machines are operating within their most efficient performance envelope — consistently, over time, across shifts.

    In practice, instability shows up as:

    • Vibration signatures that indicate misalignment, imbalance, or bearing degradation
    • Load fluctuations that force motors to draw excess current
    • Temperature deviations that signal lubrication breakdown or thermal inefficiency
    • Unplanned stops that trigger energy-intensive restart cycles

    None of these appear in an equipment spec sheet. All of them have a direct, measurable cost on the energy line.

    The Mechanics : Why Stability and Energy Are the Same Problem

    The physics is straightforward. Industrial equipment is designed to operate at peak efficiency within a narrow band. Deviate from that band — through vibration, imbalance, thermal stress, or load variation — and friction increases, resistance increases, and the motor draws more power to maintain output. The machine is doing more work to produce the same result.


    Add unplanned downtime to that picture and the energy cost compounds. Restarting a cement kiln, a large compressor, or a hot rolling mill consumes multiples of the energy required to maintain steady operation. Every unplanned stop is not just a production loss — it is an energy spike that erases hours of efficiency gains.


    Industry research consistently shows that mechanical losses from unstable operation account for 15–25% of preventable energy waste in heavy manufacturing. That figure dwarfs most ROI projections on equipment upgrade programmes.

    Where Industrial AI Has Failed — And What Changes That

    Awareness of this problem is not new. What is new is the technology to act on it — and the industry’s still-evolving ability to do so at scale.

    The industrial AI sector has spent a decade building predictive maintenance tools. Most of them generate alerts. Operators receive a notification that a bearing is degrading, that vibration is trending upward, that a temperature threshold has been breached. The research record on what happens next is not encouraging: industry data suggests that more than 90% of industrial AI pilots fail to reach sustained production deployment. The alerts are accurate. The gap between alert and action is where the value evaporates.

    This is the distinction that matters for energy efficiency. Predictive maintenance tells you something is wrong. Prescriptive maintenance tells you exactly what to do about it, in language an operator can act on immediately, validated against outcomes that have already been proven.

    Predictive maintenance creates alerts. Prescriptive maintenance closes work orders. Only one of those eliminates energy waste.

    The difference is not semantic. When a maintenance team receives an alert, they must diagnose, prioritise, resource, and schedule. Each step introduces delay. During that delay, the unstable machine continues drawing excess energy. The longer the loop between detection and correction, the greater the cumulative energy loss.


    Prescriptive systems compress that loop. They contextualise the anomaly, identify the probable root cause, recommend a specific corrective action, and assign confidence levels to each recommendation. The result is not a notification to investigate. It is an instruction to act.

    What This Looks Like at Scale : JSW Steel

    Abstract arguments about stability and energy efficiency are easy to make. The harder question is whether this works at industrial scale, under real operating conditions, across a heterogeneous asset base.


    JSW Steel — one of the largest steel producers in Asia — deployed Infinite Uptime’s PlantOS platform across 139 plants. The outcomes at scale:

    downtime
    hours eliminated
    0
    operator adoption
    rate across all sites
    0
    %
    AI-assisted work
    orders completed
    0

    The adoption figure is the one worth dwelling on. Industrial AI deployments routinely report high technical accuracy and low adoption. The gap between the two is where most programmes die. A 93% operator adoption rate across 139 plants is not a technology story. It is a trust story — evidence that the prescriptions being generated are credible, actionable, and consistently validated by the people closest to the machines.


    That trust, once established, changes the economics of energy efficiency. When operators act on AI-generated prescriptions consistently, the loop between instability and correction closes. Machines return to their optimal operating bands faster. Energy consumption stabilises. The efficiency gains compound across shifts, across plants, across years.

    What This Looks Like in Cement : Star Cement

    If JSW Steel demonstrates the model at enterprise scale across metals, Star Cement demonstrates it at plant-level depth in one of the world’s most energy-intensive manufacturing processes.


    Star Cement — a leading Asian OPC & PPC manufacturer — deployed PlantOS across four plants covering the full production chain: from mines and raw material handling through kiln, cooler, grinding, WHRS, and captive power plant. The integration scope was total: 19 systems (PLCs, DCS, energy meters, SAP, logbooks, quality systems), 492 KPIs monitored continuously, 0 missed faults.


    The prescriptions were not generic recommendations. Two examples from the Star Cement diagnostic record illustrate the specificity:

    • A raw mill tripping repeatedly due to high vibration was diagnosed to high moisture in CFA (10–20%). The prescription: reduce CFA below 10% and cover material transport. The business impact: 5–10 TPH mill throughput restored.
    • A kiln main drive trip was traced to roller-3 bearing temperature rising from 30 to 60°C. The prescription: inspect lubrication oil level, improve cooling water circulation, maintain kiln shell temperature below 250°C. The business impact: 1,000 T production saved, 2–3 hours of breakdown hours eliminated, 20–50 kcal/kg clinker SHC saved.

    These are not alerts. They are instructions with predicted business impacts, completed as closed work orders, validated by Star Cement’s own engineering teams.


    The aggregate outcome across six months, user-validated:

    Specific Heat Consumption saved
    0
    K kcal
    unplanned downtime eliminated
    0
    hrs
    throughput increase
    0
    TPH
    ROI in under 6 months — ₹47.8M (~$536K USD) annual savings
    0
    X

    The biggest change was the immediate establishment of a single source of truth.

    We moved from reactive chaos to proactive control.”

    — Mr. Dhawan Soni, E&I Head, Star Cement

    The 99% prescription act-on rate at Star Cement — matched against 99.97% prediction accuracy and zero missed faults — is the metric that explains the energy outcome. Every prescription acted upon is one more machine returned to its optimal operating band. Every machine in its optimal band is one less source of thermal inefficiency, friction loss, and energy drain. The energy savings are the aggregate of those individual corrections, compounding across plants, across shifts, across six months.

    Where Process Stability Has the Highest Energy Leverage

    The principle applies across heavy industry, but the magnitude of impact varies. The sectors with the greatest energy leverage from stability programmes share a common characteristic: they operate energy-intensive continuous processes where small deviations have outsized consequences.

    Cement Manufacturing

    Kilns and grinding circuits in cement plants operate continuously and represent 60–80% of total site energy consumption. Vibration in grinding mills, misalignment in kiln drives, and thermal instability in preheater systems all drive energy waste that conventional monitoring cannot resolve at speed.


    Star Cement — one of Asia’s leading OPC & PPC manufacturers — demonstrates exactly what prescriptive AI delivers in this environment. Across four plants and 19 integrated systems spanning PLCs, DCS, energy meters, and quality infrastructure, PlantOS monitored 492 critical KPIs and generated specific corrective prescriptions. In under six months, Star Cement’s own engineering teams validated: 920,000 kcal saved in Specific Heat Consumption, 46 hours of unplanned downtime eliminated, throughput raised by 10 TPH, and 600 tons of clinker production preserved — translating to ₹47.8 million (~$536,000 USD) in annual savings. ROI: 10x in less than six months.

    “The biggest change was the immediate establishment of a single source of truth.

    We moved from reactive chaos to proactive control.”


    — Mr. Dhawan Soni, E&I Head, Star Cement

    The energy outcome here is worth unpacking specifically. The 920,000 kcal reduction in Specific Heat Consumption was not achieved by installing new equipment. It was achieved by stabilising existing equipment: detecting a kiln roller bearing temperature rising from 30 to 60°C before it caused a main drive trip, prescribing lubrication oil replacement and water circulation, and closing the work order before the fault cascaded. Each intervention of that kind not only prevents a downtime event — it eliminates the energy spike of a kiln restart and restores the thermal efficiency the instability had been quietly eroding.

    Steel and Metals Processing

    Heavy rotating equipment in rolling mills, compressor stations, and furnace drives operates under extreme load variability. Instability-driven energy losses in these environments are measurable within hours. JSW Steel’s results demonstrate what is achievable when those losses are systematically addressed at plant level.

    Chemicals and Process Industries

    Continuous process environments require precision operating conditions. Deviations from optimal parameters drive both energy waste and product quality variation. Stability and quality are the same intervention.

    Power Generation

    In power generation, equipment reliability directly determines output efficiency. Turbine vibration, auxiliary system instability, and thermal deviations all reduce net generation per unit of fuel consumed.

    The Next Frontier : Semi-Autonomous Energy Optimisation

    The trajectory of industrial AI is moving beyond human-in-the-loop decision support. The emerging model is what might be called Semi-Autonomous Execution — where AI-generated prescriptions are validated, refined, and in some cases executed with minimal human intervention, without adding headcount.

    In energy terms, this means systems that do not merely identify instability but continuously recalibrate operating parameters in response to real-time machine health data. The gap between rated efficiency and actual efficiency narrows not just during planned interventions, but continuously, across every operating hour.

    The industrial organisations that are building toward this capability now are not doing so because they have solved every technical challenge. They are doing so because the competitive and regulatory pressure on energy performance is not decreasing — and the organisations that have already built operator trust in AI-generated prescriptions will be the ones able to deploy autonomous systems at speed when the technology matures.

    The energy crisis in heavy manufacturing is not a technology problem. It is a stability problem that most technology programmes are not designed to solve.

    How Infinite Uptime Approaches This

    Infinite Uptime built PlantOS as a prescriptive AI platform — not an analytics dashboard, not an alert engine. The core design principle is that a system’s value is measured not by the accuracy of its predictions but by the rate at which its recommendations are acted upon and validated by operators.


    The architecture reflects that principle. PlantOS contextualises machine health data — vibration, temperature, load, current — against operational baselines to generate prescriptions that tell maintenance teams not just that something is wrong, but what to do, when, and why. Those prescriptions are validated in the field and fed back into the model. The result is a system that becomes more accurate and more trusted over time.


    Across JSW Steel, Star Cement, Vedanta, and Indorama, the pattern holds: high prescription accuracy, high operator adoption, measurable outcomes at P&L level. That is the trust loop that makes sustained energy efficiency possible.

    Conclusion

    The energy crisis in heavy manufacturing is not primarily a technology problem. The technology to monitor, analyse, and act on machine health data exists. The problem is a stability problem: the gap between what machines are designed to do and how they actually operate, shift after shift, plant after plant.


    Closing that gap requires more than sensors and dashboards. It requires prescriptive intelligence that operators trust enough to act on, at the speed instability demands. When that trust is established, the energy efficiency gains are not marginal. They are structural.


    The manufacturers that are solving this problem now are not waiting for the next equipment cycle. They are building the operator trust, the data infrastructure, and the prescriptive systems that will determine their energy and competitive position for the next decade.

    Read More on Industrial Energy Efficiency

    Frequently Asked Questions


    Why do most industrial energy efficiency programmes underperform?

    Most programmes focus on equipment specifications rather than operating behaviour. A motor rated at 95% efficiency may operate at 78% efficiency under unstable conditions. The gap between rated and actual performance is where the energy is lost — and it is invisible to programmes that do not monitor machine stability continuously.


    What is the difference between predictive and prescriptive maintenance for energy efficiency?

    Predictive maintenance generates alerts when anomalies are detected. Prescriptive maintenance generates specific corrective actions, ranked by confidence, that operators can execute immediately. Only prescriptive systems close the loop between detection and correction fast enough to prevent energy losses from accumulating.


    How quickly do energy efficiency gains materialise from a stability programme?

    In rotating-equipment-heavy environments such as cement and steel, measurable gains are typically visible within the first quarter of deployment. Long-term structural gains compound as operator adoption increases and the AI system accumulates validated outcome data.


    Why does operator adoption matter so much for energy outcomes?

    Prescriptions that are not acted upon have no energy impact. High adoption rates — such as the 93% achieved across JSW Steel’s 139 plants — mean that the loop between instability detection and corrective action closes consistently. It is the act-on rate, not the detection rate, that determines energy performance.


    Is this approach applicable to mid-size manufacturers, or only at enterprise scale?

    The underlying physics applies regardless of plant size. The economics become most compelling at scale, but the entry point for stability-based energy programmes has reduced significantly as IIoT sensor costs and cloud-based AI platforms have matured.

  • Beyond the Trendline: How PlantOS™  Prescriptive AI Solves the VRM “Discovery Gap”

    Beyond the Trendline: How PlantOS™ Prescriptive AI Solves the VRM “Discovery Gap”

    Beyond the Trendline: How PlantOS™ Prescriptive AI Solves the VRM “Discovery Gap”

    Read Time: 5–6 minutes | Author – Kalyan Meduri Industrial cement plant with VRM system where PlantOS™ Prescriptive AI detects hidden vibration and drive-train failures


    Vertical Roller Mill (VRM) in a cement plant monitored using PlantOS prescriptive AI for predictive maintenance and vibration failure detection
    Vertical Roller Mill

    In the heavy industrial sectors of EMEA, specifically within cement manufacturing, a dangerous “Discovery Gap” has emerged. While most plant heads rely on standard SCADA dashboards to report equipment health, these systems are often blind to the subtle frequency signatures that precede catastrophic failure.Traditional monitoring looks for thresholds (Is it too hot? Is it vibrating too much?). PlantOS™ looks for signatures.Through our work across major cement hubs in the UAE, KSA, and Europe, our Prescriptive AI has analyzed over 100 VRM (Vertical Raw Mill) drive-trains. Our findings are startling: Over 60% of critical VRM failures occur while overall vibration levels appear within “safe” operating zones.

    1. The 4.2 mm/s “Safety” Illusion (UAE Case Study)

    At a major cement facility in the UAE, the Mill-2 Motor was trending at a steady 4.2 mm/sec. By industry standards, this is a healthy “green” status. However, PlantOS™ flagged a high-priority prescriptive alert.
    The Prescriptive Signature:PlantOS™ detected a dominant 1x RPM peak at 16.5 Hz accompanied by sinusoidal impacts in the time waveform. The AI diagnosed this not just as vibration, but as a specific coupling problem and “soft foot” on the motor base.

    User Validation: “Following the PlantOS™ alert, our maintenance team inspected the drive-train during a planned stop. We confirmed significant gear wear between the pinion and gearbox that would have caused a catastrophic trip.”

    The Business Impact: By acting on the AI’s prescription, the plant saved an estimated 24 hours of unplanned downtime.


    PlantOS diagnostic report showing VRM main drive vibration analysis detecting bearing lubrication issue in cement plant in KSA
    DRS Report for Cement Mill VRM Drive

    Stop managing by averages. Learn how PlantOS™ identifies hidden drive-train risks here.

    2. The 7-Day Acceleration Spike (KSA Case Study)


    PlantOS™ Diagnostic Report for 363 RM-1 VRM Main Drive in KSA showing bearing lubrication issue and 16-hour downtime savings
    DRS Report for VRM Main Drive

    In the Southern Province of KSA, a Raw Mill Main Drive appeared stable until PlantOS™ detected a massive surge in total acceleration—jumping from 109 (m/s2)2 to 404 (m/s2)2 in a single week.

    The Prescriptive Signature:

    While velocity trends remained manageable, PlantOS™ identified minor amplitudes of non-synchronous frequencies. The AI prescribed immediate re-lubrication of the Motor NDE bearing (SKF NU2044E).
    User Validation: The site team followed the prescription and re-lubricated the bearing immediately. The friction levels normalized within the hour, preventing a motor seizure.The Business Impact: This single intervention preserved 16 hours of production time, preventing a full bearing replacement and unplanned shutdown.
    Before and after vibration acceleration trend for VRM main drive bearing showing spike from 109 to 404 m/s² detected by PlantOS prescriptive AI in KSA cement plant

    Don’t wait for the trip. Explore our Prescriptive Maintenance solutions for Cement.

    3. The Post-Maintenance Paradox (EMEA Case Study)

    One of the most frustrating challenges for Plant Managers is high vibration immediately after a scheduled maintenance shutdown. This occurred at an EMEA Raw Mill where vibrations fluctuated up to 16 mm/sec at the Motor NDE despite recent service.

    The Prescriptive Signature:

    PlantOS™ identified a dominant 16.296 Hz peak at both Motor DE and NDE. It prescribed a precision reassessment of the alignment between the Motor and pinion pulleys.

    The Result: After the site team implemented the AI’s precision alignment recommendations, they achieved a 72.65% reduction in vertical velocity, dropping from 6.40 mm/sec to a near-perfect 1.75 mm/sec .


    Infinite Uptime diagnostic report for VRM Mill-3 highlighting vibration fluctuation, belt and pulley misalignment issue, corrective alignment service, and downtime savings of two hours.
    DRS Report for VRM Mill

    Before and after repair vibration spectrum analysis of VRM Mill-3 motor showing significant reduction in axial, horizontal and vertical velocity levels after alignment and pulley maintenance by Infinite Uptime.

    Frequently Asked Questions


    Why is 4.2 mm/s considered “unsafe” by PlantOS™?

    While 4.2 mm/sec  is often within ISO 10816-3 limits for large machines, “overall” values mask high-frequency impacts. PlantOS™ looks at the FFT spectrum to identify specific faults like gear meshing or coupling wear that overall velocity averages out.


    How does “Prescriptive” AI differ from “Predictive” Maintenance?

    Predictive maintenance tells you when a machine might fail. PlantOS™ Prescriptive AI tells you what is failing and how to fix it (e.g., “re-lubricate Motor NDE bearing”). This allows maintenance teams to act instantly with user-validated accuracy.


    Can PlantOS™ integrate with our existing SCADA or PLC?

    Yes. PlantOS™ is designed as a data-agnostic layer that bridges the gap between raw sensor data and operational decision-making, providing a unified view of asset health across cement, steel, and mining verticals.

    The PlantOS™ Prescriptive Audit

    To help your team identify these “Stealth Killers,” we have compiled the three most critical signatures PlantOS™ monitors in Vertical Roller Mills:

    Failure Signature Diagnostic Indicator Recommended Action
    16.296 Hz Dominant Peak Pulley/Belt Misalignment Reassess precision alignment & check belt tension.
    1x RPM (16.5 Hz) + Sinusoidal Wave Coupling/Soft Foot Inspect coupling elements; correct motor base foot.
    High Non-Synchronous Amplitudes Lubrication Starvation Immediate re-lubrication of NDE bearings.

    The Bottom Line

    With the 99% Trust Loop—where PlantOS™ prescriptions are user-validated and adopted by maintenance teams almost every time (up to 99%)—reliability decisions are no longer a matter of guesswork. In the cement industry, true reliability isn’t about having more data; it’s about having prescriptive intelligence you can trust. PlantOS™ doesn’t just tell you that your mill is vibrating—it tells your team exactly where to look and how to fix it before the profit stops..

    Ready to close the Discovery Gap? See the PlantOS™ full technical capabilities for Cement plants here.

    Related Blog

  • AI4ProductionOutcomes: Closing the Industrial AI Outcome Gap with PlantOS™ 99% Trust Loop

    AI4ProductionOutcomes: Closing the Industrial AI Outcome Gap with PlantOS™ 99% Trust Loop

    AI4ProductionOutcomes: Closing the Industrial AI Outcome Gap with PlantOS™ 99% Trust Loop

    Read Time: 5–6 minutes | Author – Kalyan Meduri AI4ProductionOutcomes | Closing the Industrial AI Outcome Gap with PlantOS™

    For years, industrial leaders have poured money into dashboards and monitoring tools promising better visibility. But when a critical machine fails at 2 a.m. or energy costs keep climbing unnoticed, those charts rarely tell you: “What do we do right now?”

    Visibility Isn’t Enough

    CEOs, CFOs, and plant managers face real pressure to hit higher uptime, slash costs per unit, boost safety, and lock in predictable performance.
    A black and white portrait of "Frank CEO", a man in a suit and striped tie, looking directly at the viewer with a neutral expression. Frank
    CFO

    Reduce

    Conversion Cost per Unit Produced

    Raise

    Utilization Growth %

    Safeguard

    ROI / Value Creation per Unit Time per Unit Area

    A black and white portrait of "Chad COO", a man with curly hair, glasses, and a beard, smiling at the viewer with arms crossed, in a suit. Chad
    COO

    Reduce

    Cost of Maintenance per Unit Produced

    Raise

    Safety & Risk Management

    Safeguard

    ROI / Production Agility

    A black and white portrait of "Derek CDO", a man with a shaved head, glasses, and a beard, holding a phone, looking confidently at the camera. Derek
    CDO

    Reduce

    Digital Tool Scatter / Integration Complexity

    Create

    AI-driven Site-wise Dashboards + Schedules

    Safeguard

    ROI-centric Digital Transformation

    A black and white portrait of "Peter - Plant Head", a smiling man in a hard hat, safety vest, and ear protection, with his arms crossed. Peter
    Plant Head

    Raise

    Output Growth %

    Create

    % Decisions Based on AI Prescriptions

    Safeguard

    Cost Competitiveness

    A black and white headshot of "Mike - Maintenance manager", a young man in a white hard hat and work jacket, smiling genuinely at the camera. Mike
    Maintenance Manager

    Eliminate

    Unscheduled Downtime Hours

    Create

    % AI Prescriptions Accepted & Acted Upon

    Safeguard

    Asset Reliability

    A black and white portrait of "Emaad - Energy Manager", a smiling man with a beard, wearing a hard hat and safety vest, with his arms crossed. Emaad
    Energy Manager

    Reduce

    Cost of Energy per Unit Produced

    Safeguard

    Energy Efficiency

    A black and white portrait of "Disha - Digitalization Manager", a smiling woman in a white hard hat and safety vest, looking directly at the camera. Disha
    Digitalization Manager

    Raise

    Productivity Growth %

    Create

    Digital Ways of Working

    Safeguard

    Digital Transformation ROI

    #AI4ProductionOutcomes

    #MyGoalsMyOutcomes

    AI4ProductionOutcomes flips the script on industrial & Prescriptive AI, moving from data overload to outcome-driven decisions. Platforms like PlantOS™ serve as an industrial Plant orchestration system, blending prescriptive AI, online condition monitoring, and human expertise for reliable results in steel mills, cement plants, and beyond.

    Defining AI4ProductionOutcomes

    This isn’t generic analytics—it’s a prescriptive maintenance solution laser-focused on production outcomes. Industry-trained AI turns raw data from equipment, processes, and energy systems into answers:

    What’s failing? Why? What action fixes it? What’s the impact on uptime, throughput, and energy efficiency?

    PlantOS™, for instance, uses vertical AI models trained on 85,000+ locations with 50+ asset types across steel, cement, chemicals, mining, pharma, tires, paper, and food processing, hitting up to 99.97% fault prediction accuracy, and up to 99% prescription implementation rate.
    The key idea is simple but powerful:
    “Consistent value delivery matters more than occasional perfection.”

    The Numbers That Expose the Gap

    Plants already drown in vibration data and inputs from SCADA, PLCs, energy meters, and logs. Yet as per industry reports, unplanned downtime costs factories up to $50 billion annually worldwide, averaging 800 hours per plant (roughly 15+ hours weekly). Meanwhile, energy waste claims 12-22% of industrial consumption due to inefficiencies.Most competitors stop short: delivering raw sensor plots, dashboard visualizations, integrated monitoring views, and even predictive or prescriptive analytics—but rarely closing the loop to validated outcomes. ​​
    Industrial AI competitive value ladder showing how PlantOS 99 percent Trust Loop closes the outcome gap from sensor data to validated production outcomes in manufacturing plants The real gap? Decision confidence amid the “Outcome Gap,” where insights don’t drive action. Teams hesitate: Stop the line or risk it? False alarm or real threat? Maintenance now or later? PlantOS™ goes further with its 99% Trust Loop™—predictive + prescriptive AI plus operator-validated outcomes—for 99%+ action rates, eliminating 115,704 downtime hours across 844 plants. Without this user-validated step, alerts get ignored, turning small glitches into big losses.

    What Sets PlantOSTM Apart

    PlantOS™ stands out through its 99% Trust Loop™, a closed-loop prescriptive AI framework that goes beyond competitors’ alerts to deliver validated outcomes. ​

    • Seamless Data Flow: Unifies siloed sources (SCADA, PLC, DCS, SAP) for holistic, plant-wide views—contextualizing 99% of equipment and processes in weeks.
    • Industry-Specific AI: Vertical models trained on 80,000+ assets grasp failure modes like gearbox wear in cement or mill faults in steel, achieving 99.97% accuracy with zero false negatives.
    • Multi-Outcome Prescriptions: Generates specific actions optimizing uptime, energy efficiency (up to 2% savings/ton), and throughput simultaneously—not just single-asset alerts.
    • Operator Validation Loop: 24/7 experts + workflows ensure 95-99% action rates; every outcome feeds back to refine AI, building unbreakable trust (28,551 validated results).

    This orchestration closes the “Outcome Gap,” turning pilots into enterprise-scale wins across 844 plants globally.

    Vertical AI for Outcomes: Connecting Industrial AI to Measurable Results

    What Is Vertical AI for Outcomes?

    Vertical AI for Outcomes is an approach to industrial AI that replaces generic, one-size-fits-all failure prediction with equipment-specific and industry-specific intelligence. It tells operators exactly what to fix, why, and by when then validates whether the fix actually worked. Vertical AI for Outcomes connects industry-specific intelligence with actions that improve plant performance. In heavy manufacturing, equipment behavior depends not only on mechanical condition but also on production loads, process variables, and operating conditions. PlantOS™ combines equipment and process data with industry-specific AI models to diagnose developing faults and recommend corrective actions suited to each asset and its operating context. Through PlantOS™’s 99% Trust Loop, operators review and validate maintenance prescriptions, and verified results feed back into the system. This helps move industrial AI beyond dashboards and alerts toward maintenance actions linked to measurable outcomes, including improved equipment reliability, reduced unplanned downtime, energy efficiency, and throughput. 

    By connecting industry-specific AI, prescriptive maintenance, and operator-validated results, PlantOS™ helps manufacturers turn industrial AI insights into Vertical AI for Outcomes across heavy manufacturing industries.

    The 99% Trust Loop in Action

    Proven across harsh environments like steel mills, cement plants, mines, and chemical units, PlantOS™ follows the 99% Trust Loop™—a four-step closed-loop for validated outcomes: ​

    • Contextualize: Builds multi-asset graphs unifying 99% of equipment/process data (SCADA, sensors, MES) against benchmarks in weeks—not months.
    • Predict & Prescribe: AI analyses real-time signals for 99.97% accurate diagnoses (e.g., “bearing failure in 72 hours”), issuing multi-outcome actions balancing uptime, energy, and throughput.
    • Execute & Learn: Operators validate via workflows (95-99% action rate); feedback refines prescriptions, eliminating interpretation delays.
    • Validate Outcomes: Confirms results like 115,704 downtime hours saved or 2.5% utilization gains at JSW Steel (139 plants), turning trust into a KPI.

    This self-improving loop has digitized 844 plants in 26 countries, proving prescriptive maintenance at scale.

    World’s Biggest AI Success Story

    The 99% Trust Loop™ delivers 6-10x multipliers over conventional predictive AI, as shown in this comparison from real deployments (e.g., JSW Steel vs. typical prior art).

    Dimension Predictive AI
    (Prior Art)
    The 99% Trust Loop
    (PlantOS™)
    Multiplier
    Avoided Events / Work Orders 900 8,610 9.6x
    Downtime Hours Saved 4,500 30,096 6.7x
    Deployment Scale 36 sites 139 plants 3.9x
    System Focus Asset health alerts Multi-outcome orchestration Category shift

    Beyond Productivity

    The 99% Trust Loop™ delivers compounding value beyond uptime and costs, strengthening plant resilience under real pressure. ​

    • Safety: Fewer emergency breakdowns reduce high-risk shop-floor interventions.
    • Sustainability: Up to 2% energy reduction per ton cuts waste and emissions from existing assets.
    • Governance: Auditable KPIs (28,551 validated outcomes) and 99%+ action rates build confidence in operational commitments.

    Deployed across 844 plants in 26 countries and 9 verticals, PlantOS™ turns AI into predictable EBITDA—triple-digit million top-line gains at JSW Steel alone. ​
    Plants need control, not more charts. AI4ProductionOutcomes with PlantOS™ prescriptive AI moves you from reactive firefighting to validated, semi-autonomous operations—shift after shift.

    Read More on Prescriptive Maintenance
  • The AI Impact Summit’s Biggest Blind Spot – Who Validates AI Success

    The AI Impact Summit’s Biggest Blind Spot – Who Validates AI Success

    The AI Impact Summit’s Biggest Blind Spot – Who Validates AI Success

    Read Time: 5–6 minutes | Author – Dr. Raunak Bhinge
    Engineers and executives reviewing AI insights, illustrating who validates AI—shop floor or boardroom.

    By Dr. Raunak Bhinge
    As world leaders gather in New Delhi for the India–AI Impact Summit 2026, the conversation remains dangerously fixated on foundation models, compute democratization, and low-cost AI applications. But there’s a far more consequential question the Summit must confront: When we say AI “works,” who exactly is doing the saying?

    The Summit Promised “Impact.” Let’s Talk About Whose Impact.

    India has done something bold with this Summit. By shifting the global AI conversation from “Safety” (Bletchley Park, 2023) and “Action” (Paris, 2025) to “Impact” (New Delhi, 2026), the host nation has signalled that the era of AI navel-gazing is over. The three Sutras—People, Planet, Progress—and the seven Chakras are ambitious. They demand measurable outcomes, not more whitepapers.But here is where the narrative cracks.Scan the Summit’s agenda. The dominant discourse revolves around foundational LLMs for Indian languages, affordable compute infrastructure, AI governance frameworks, and yes—the inevitable parade of AI startups doing clever things with chatbots and image generators. All important. None sufficient.
    What’s glaringly absent is the hardest, most honest question in enterprise AI today: Are we measuring AI success by what the C-suite reports to investors, or by what the human operator confirms on the factory floor?
    This distinction isn’t semantic. It is the difference between AI theatre and AI impact.

    The Inconvenient Truth About the World’s “Biggest” AI Success Stories

    Let me be direct. The world’s most celebrated industrial AI deployments—the ones that headline Forbes features and analyst reports—are riddled with a fundamental measurement flaw.
    Consider what the global AI community currently celebrates as best-in-class:
    A leading Fortune 500 food and beverage company’s widely lauded predictive maintenance deployment—the one referenced in countless case studies about “escaping pilot purgatory”—reports approximately 900 avoided downtime events across 36 pilot sites, saving roughly 4,500 hours of downtime. These are impressive numbers. They earned multiple magazine covers.
    But ask this: Who validated those 900 events? Was it the machine learning model’s own scoring rubric? Was it the technology vendor’s internal assessment? Was it the corporate data science team’s dashboard? Or was it the maintenance technician who physically opened the motor, confirmed the bearing failure, replaced the part, and documented the outcome?
    The answer, in most celebrated AI deployments globally, is uncomfortable: validation happens at the corporate level, not the operator level. The AI model predicts, the dashboard displays, the annual report claims. What’s missing is the closed loop—the operator who says, “Yes, this prediction was correct. Yes, I acted on it. Yes, the outcome was real.”
    This isn’t a minor nuance. It is the single biggest reason MIT’s NANDA initiative found in 2025 that 95% of enterprise AI pilots fail to deliver measurable P&L impact. Not because the algorithms are bad. Not because the compute is insufficient. But because enterprises are measuring AI with the wrong ruler.
    User-validated AI on the shop floor compared with corporate-validated AI in a boardroom. Let me define the terms clearly, because the AI industry has been deliberately vague about this for too long.Corporate-Validated AI means: A model generates a prediction. An internal team reviews dashboards. A slide deck claims value. Success is measured by model accuracy scores, alert volumes, or estimated savings calculated by the vendor’s own methodology. The operator—the person closest to the physical reality—is a passive consumer of alerts, not an active validator of outcomes.User-Validated AI means: A model generates a prediction. That prediction becomes a specific prescription—not an alert, but a work order with a clear action. The operator executes. The operator confirms: Did the predicted failure actually exist? Was the prescribed action correct? What was the measurable outcome? Every single outcome carries an auditable, human-confirmed signature.The difference is not incremental. It is categorical.
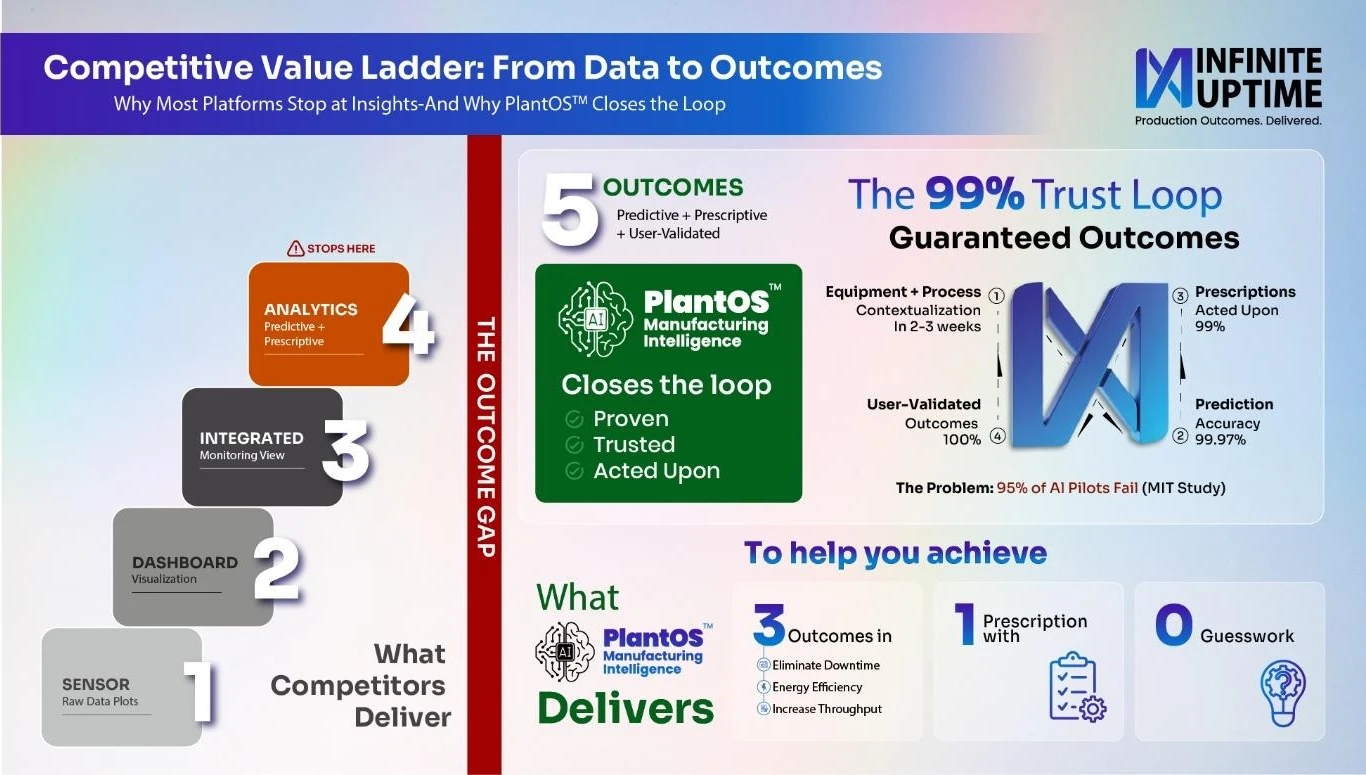
    Corporate validation tells you what the AI thinks happened. User validation tells you what actually happened. And until we are honest about which one we’re counting, the 95% failure rate will persist, and “AI Impact” will remain a Summit theme rather than an enterprise reality.

    The Numbers That Expose the Gap

    Consider a side-by-side comparison that should give pause to every CXO and policymaker at this Summit:
    The globally celebrated predictive maintenance benchmark—36 pilot sites, ~900 avoided events, ~4,500 downtime hours saved. Technology: predictive (alert-based). Validation method: corporate and vendor-reported.

    JSW Steel – The World’s Most User-Validated Success Story

    Now consider what a Made-in-India prescriptive AI platform—PlantOSTM, built by Infinite Uptime—has achieved at a single enterprise. JSW Steel, India’s leading integrated manufacturer, deploying across 139 sites in India and the USA: 8,610 AI-assisted work orders generated with 99.97% prediction accuracy; 93% prescriptions acted upon by frontline operators; 30,096 downtime hours eliminated; every single outcome confirmed by the operator who executed the work.The multiplier isn’t marginal. It is 6.7× more downtime hours saved, 9.6× more validated work orders, at 3.9× the deployment scale. And the fundamental architectural difference? Every outcome in the Indian and American deployment is user-validated—confirmed by the human who turned the wrench, not by the algorithm that suggested it.
    This is not just about Predictive AI Vs Prescriptive AI. This is about a measurement philosophy that the world hasn’t yet adopted but desperately needs to.

    Why 95% of AI Pilots Fail: The Trust Architecture Was Never Built

    MIT’s 2025 study, The GenAI Divide: State of AI in Business 2025, deserves more attention at this Summit than any foundation model announcement. Based on 150 executive interviews, surveys of 350 employees, and analysis of 300 public AI deployments, the findings are unequivocal:

    Only 5% of enterprise AI pilots achieved measurable business impact. The remaining 95% stalled—not because the technology failed, but because the enterprise integration failed. The core issue, as MIT’s lead researcher Aditya Challapally put it, is not model quality but the “learning gap” between tools and organizations.Translate this into manufacturing: A predictive model that achieves 95% accuracy sounds impressive until you realize that the remaining 5% error rate destroys operator trust. When one in twenty alerts is wrong, operators learn to second-guess all alerts. The system degrades not through technical failure but through human withdrawal. Dashboards keep updating. Nobody acts.
    This is precisely the phenomenon that industrial operators describe as the Outcome Gap—the chasm between AI-generated insights and validated operational outcomes. Alerts are abundant. Dashboards are comprehensive. Real, repeatable EBITDA impact remains elusive.
    The only architectural solution is to build trust into the AI system itself—not as an afterthought, not as a user adoption initiative, but as a quantifiable KPI that the system measures, tracks, and optimizes. This is precisely the insight that inspired me to architect what some of our trusted users call it as – The 99% Trust Loop: a closed-loop Prescriptive AI orchestration methodology where every AI prescription must survive the gauntlet of operator action and outcome confirmation before it counts as “impact.”
    Competitive value ladder infographic showing how PlantOS Manufacturing Intelligence closes the outcome gap by moving from sensor data and dashboards to predictive, prescriptive, user-validated outcomes, highlighting the 99% trust loop and why most AI platforms stop at analytics. We follow a Show & Grow Model of Outcome Value Delivery. We don’t ask manufacturers to trust our algorithms on faith. We show validated outcomes first—operator-confirmed, auditable, measurable—and then we grow across the enterprise. The industry has been celebrating AI accuracy as if the algorithm’s confidence score is the finish line. It isn’t. The finish line is when a maintenance/production technician in Bellary or Baytown opens a motor, confirms the failure we predicted, replaces the part, and signs off that the downtime was avoided/utilization rate is increased. Until that signature exists, you don’t have AI impact—you have AI opinion.

    When prediction accuracy crosses 99%, something profound shifts in human behaviour: operators stop second-guessing and start acting. When prescriptions are specific and pin-pointed enough to eliminate interpretation burden, action rates rise from industry-typical 30-40% to above 90%.
    This is not a technology problem. It is a design philosophy problem. And it is one that Indian innovation has already solved at scale.

    India’s Real AI Story Isn’t About Language Models

    Let me be clear about what I’m arguing. The IndiaAI Mission’s investments in Bhashini, in compute infrastructure, in AI skilling—these are necessary and commendable. India’s AIRAWAT initiative to provide affordable GPU access at under a dollar per hour is genuinely democratizing. The Youth Challenge, the Global Impact Challenge, the Research Forum—all worthy.
    But India’s most globally significant AI contribution isn’t a language model. It is the demonstrated proof—pioneered by my colleagues at Infinite Uptime, and validated at industrial scale across 844+ plants in 26 countries and 9 industry verticals—that AI outcomes can be user-validated, operator-confirmed, and auditably guaranteed.
    This matters for the Global South narrative that the Summit champions. When an Indian AI platform deploys across steel plants in India and USA, cement factories in the Middle East, and chemical plants in Southeast Asia and Africa—with each outcome validated by the local operator in that facility—it creates something the world’s largest technology companies have not yet achieved: a trust infrastructure for AI that scales across geographies, cultures, and skill levels.
    The Summit’s “Resilience, Innovation, and Efficiency” Chakra asks how AI can drive productivity and operational resilience. The answer is already deployed at 844 sites globally. The Chakra asks how trust can be built into AI systems. The answer is a methodology where trust isn’t a subjective perception but a measurable KPI—tracked at 99% action rates across hundreds of facilities. Hands holding a digital globe labeled “User-Validated Impact,” surrounded by icons representing AI for economic development, safe and trusted AI, human capital, science, inclusion, resilience, and democratizing AI resources.

    A Challenge to the Summit: Adopt the User-Validation Standard

    As India hosts 100+ countries, 15-20 heads of government, and 40+ global CEOs, I want to propose something concrete for the Leaders’ Declaration:
    Establish User-Validated Outcomes (The 99% Trust Loop) as the global standard for measuring AI impact in industrial and enterprise applications.
    This means:
    Every enterprise AI deployment claiming “impact” must disclose whether its outcomes are validated by end-users (the operators, workers, and professionals who interact with the AI) or by corporate/vendor teams. Every government initiative measuring AI ROI—from healthcare to agriculture to manufacturing—must include user-confirmation data, not just model performance metrics. Every AI vendor seeking public procurement contracts must demonstrate closed-loop validation, not open-loop prediction.
    This standard would do more to accelerate genuine AI adoption than any compute subsidy or model benchmark. It would finally give meaning to the Summit’s own promise: that AI Impact is measurable, inclusive, and real.

    The Question the Summit Must Answer

    The India–AI Impact Summit 2026 has every right to celebrate India’s AI ambitions. The country’s foundation model initiatives, its compute democratization, its AI governance guidelines—all signal a nation that takes AI seriously.
    But if the Summit ends with declarations about LLM benchmarks and affordable GPU hours without addressing the fundamental question of how we measure whether AI actually works for the humans using it, then “Impact” will remain a word on a banner, not a standard for the world.
    The global AI industry has spent two decades perfecting prediction. It is time to perfect validation.
    India has already shown the way. The question is whether the world is ready to adopt the standard.

    About the Author

    Dr. Raunak Bhinge is the Founder and Managing Director of Infinite Uptime Inc, an industrial AI pioneer that offers PlantOSTM—the world’s most user-validated Prescriptive AI platform for semi-autonomous manufacturing outcomes. Under his leadership, Infinite Uptime has grown into a trusted partner for some of the world’s largest process manufacturers across cement, steel, mining & metals, paper, chemicals, tires, energy, food & beverage, and pharma verticals, delivering the 99% Trust Loop and production outcomes such as MTBF, throughput, and energy per ton.With a B.Tech/M.Tech from IIT Madras and a PhD in Smart Manufacturing from the University of California, Berkeley, Raunak has spent his career at the intersection of advanced manufacturing, digital transformation, and artificial intelligence. He holds 5 patents and 14 international publications, and is a frequent speaker at global industry forums on Industry 4.0, industrial AI, and the future of manufacturing intelligence.
    raunak@infinite-uptime.com | LinkedIn

    References:

    • MIT NANDA Initiative, The GenAI Divide: State of AI in Business 2025 (July 2025)
    • India–AI Impact Summit 2026, Official Summit Framework: Three Sutras and Seven Chakras
    • Forbes, How PepsiCo Avoids Pilot Purgatory with Innovation Partnerships (2024)
    • LNS Research, JSW Steel Case Study — Third-party validation of PlantOSTM deployment outcomes
    • PlantOSTM Platform Data, Infinite Uptime Inc. (November 2025)
    • Crowell & Moring, Setting the Agenda for Global AI Governance: India to Host AI Impact Summit (2025)

    Disclaimer: The views expressed are the author’s own and do not represent the official position of any organization. Data cited is sourced from publicly available reports and third-party validated platform metrics.

  • The Four Pillars of Industrial Reliability

    The Four Pillars of Industrial Reliability

    The Four Pillars of Industrial Reliability: How Asset, Plant, Production, and
    Digital Reliability Drive Uptime, Energy Efficiency, and Throughput

    Read Time: 5–6 minutes | Author – Kalyan Meduri


    In heavy industries today, reliability is no longer just “fewer breakdowns.” It is the combined effect of asset reliability, plant reliability, production reliability, and digital reliability working together to maximize uptime, optimize energy use, and ensure consistent throughput.
    Why These Four Pillars Matter Now
    Industrial plants face rising maintenance, power, and fuel costs, stricter safety norms, and volatile demand. In this environment, running “mostly okay” is not enough; you need a reliability strategy that is systemic (asset, process, and plant), outcome-driven (production), and data-backed (digital).

    Plants that invest only in predictive maintenance on a few critical machines often still firefight—process bottlenecks, unreliable utilities, or untrusted analytics keep pulling them back into unplanned stops, unstable energy performance, and missed throughput targets. Even advanced predictive tools fall short without prescriptive actions that address root causes, coordinate across teams, and optimize energy alongside uptime.

    Asset Reliability: Keeping Critical Machines Out of Trouble

    Asset reliability is the ability of individual equipment—motors, pumps, gearboxes, fans, kilns, compressors, conveyors—to perform their intended function without failure under defined operating conditions. 

    In practice, it answers one question:

    “Will this asset fail, and what can we do right now to prevent it? ” ​

    When asset reliability is high, plants see:

    • Reduced unplanned downtime : Early detection of degradation prevents sudden failures that disrupt production schedules and cause cascading operational losses.
    • Lower maintenance cost per unit : Planned, condition-based interventions replace emergency repairs, reducing overtime, spare part wastage, and secondary damage.
    • Improved workplace safety : Equipment failures often create hazardous situations; reliable assets reduce the risk of sudden mechanical or electrical incidents that endanger personnel.
    • Extended equipment life : Operating assets within healthy limits minimizes excessive wear, preserving asset integrity and delaying capital replacement​

    How Asset Reliability Is Built

    Modern reliability teams move beyond calendar-based PMs to continuous, sensor-driven visibility:

    • Continuous condition monitoring using vibration, temperature, current, pressure, and process data to reveal misalignment, imbalance, looseness, lubrication issues, and bearing defects early.
    • Clear understanding of dominant failure modes and degradation patterns per asset class (e.g., conveyor gearboxes vs. kiln drives vs. ID fans), so interventions are precise, not generic.
    • Use of metrics like MTBF and Remaining Useful Life (RUL) to prioritize work, schedule stoppage, and quantify risk if an asset is run to the next window. ​
    • Predictive and prescriptive maintenance that not only detects anomalies but prescribes specific actions—such as “realign motor–gearbox” or “inspect 4th-stage gear during next planned stop.” ​


    PlantOS diagnostic report detecting pinion bearing vibration and girth gear meshing fault in ball mill at steel pellet plant using prescriptive maintenance

    Steel example – Prescriptive ODR on ball mill

    In a pellet plant ball mill, rising pinion-bearing vibration at the girth-gear meshing frequency triggered a diagnostic report that pinpointed improper gear meshing from wear and misalignment. 

    Prescriptive diagnostics guided the team to inspect pinion–girth gear backlash, tooth clearances, and alignment, then correct backlash, clearance, and misalignment within recommended limits.

    By executing these actions before the fault escalated, the plant avoided an estimated six hours of ball mill downtime while stabilizing vibration at the pinion bearings—protecting a critical grinding bottleneck, safeguarding gear and bearing life, and preserving pellet throughput without a forced shutdown.

    Plant Reliability: Making the Whole System Run as One

    Plant reliability is the ability of the entire production system—asset/equipment, process trains, utilities, and supporting infrastructure—to run as designed without cascading failures or chronic instability. 

    It answers a tougher question than “Is each asset healthy? ”—it asks, “Will the plant stay stable, shift after shift, when everything is coupled together? ” ​

    Even when individual assets are healthy, plants suffer if:

    • Utility systems (power, compressed air, water, fuel, cooling) are unstable.
    • Interdependencies and bottlenecks are poorly understood.
    • Maintenance and operations pull in opposite directions on scheduling and priorities. ​

    High plant reliability shows up as:

    • Stable production schedules with fewer full-plant or line-level trips.
    • Less “domino effect” from a single failure propagating into upstream and downstream losses.
    • More coordinated decision-making between operations, maintenance, and energy teams. ​

    How Plant Reliability Is Built

    Reliability leaders treat the plant as an integrated network, not a list of assets:

    • Mapping critical process paths, constraints, and failure propagation—for example, how a single ID fan or EP fan can halt a kiln and downstream grinding.
    • Elevating reliability of utilities and support equipment to the same criticality as primary production assets, because a single weak utility can repeatedly trip production. ​
    • Aligning maintenance windows, changeovers, and cleaning with production plans, so interventions protect—not disrupt—throughput and energy performance.


    PlantOS process diagnostic report detecting kiln roller bearing temperature spike causing kiln drive trip in cement plant pyro line

    Cement example – kiln roller trip that destabilized the line

    In a cement plant, the Line-2 kiln repeatedly stopped when Roller-3 bearing temperature spiked from about 30 to 60 °C, triggering main drive trips and halting the entire pyro line from 23:05 to 1:30 on a single night. A process diagnostic report traced the trips to inadequate roller-bearing lubrication and ineffective cooling water circulation, rather than a single mechanical defect. ​

    The system prescribed plant-level actions—restore lubrication oil condition and level, improve cooling water circulation, and maintain kiln shell temperature below 250 °C—to stabilize the roller and protect the kiln drive. By closing these utility and process gaps, the plant avoided an estimated 2–3 hours of repeat breakdowns, safeguarded roughly 1,000 tons of clinker production, and cut specific heat consumption by 20–50 kcal/kg, transforming a recurring kiln-line vulnerability into a more reliable kiln system.

    Production Reliability: Hitting Downtime, Throughput, and Energy & Process Efficiency Targets

    Production reliability is about outcomes: delivering planned output at the required quality, cost, and energy intensity. 

    It answers: “Can we consistently meet what we promised—on unplanned downtime, energy & process efficiency, and throughput? ”


    Key benefits of strong production reliability include:

    • Meeting customer delivery commitments without expediting, last-minute overtime, or juggling orders.
    • Stabilized energy consumption per ton, since stops, starts, and process swings are major drivers of energy waste in heavy industries. ​
    • Lower scrap and rework because process conditions hold tighter around the target window.

    How Production Reliability Is Built

    Production reliability emerges when equipment, process control, and operational decisions are aligned:

    • Throughput consistency: Minimizing micro-stoppages, speed losses, and chronic minor jams that rarely appear as “breakdowns” but erode output every shift. ​
    • Quality stability: Tight control of process variables (e.g., kiln feed chemistry, paper moisture profile, rolling mill tension) to reduce off-spec batches and grade changes gone wrong. ​
    • Smart response to unplanned downtime: Protecting bottlenecks, re-sequencing orders, and using prescriptive actions to minimize the production and energy impact of unavoidable stops.
    • Maintenance aligned to production goals: Prioritizing interventions by their impact on throughput, energy per ton, and quality—not just asset condition scores.

    Cement example – turning a complex plant into an outcome engine


    PlantOS 99 percent Trust Loop infographic showing prescriptive AI contextualizing equipment and process data to deliver validated production outcomes in cement plants

    A leading cement producer in the Middle East used an AI‑driven plant platform to connect 6 functional areas, 19 systems, and 492 KPIs across mines, raw mills, kilns, WHRS, CPP, and grinding lines into a single, contextualized view of reliability and production. Within six months, prescriptive diagnostics and process recommendations eliminated 46 hours of unplanned downtime, lifted clinker line throughput by around 10 tph, and cut specific heat consumption by about 920,000 kcal—delivering a 10x ROI by simultaneously improving uptime, throughput, and energy efficiency rather than chasing isolated failures.

    Digital Reliability: Trusting the Data Enough to Act

    Digital reliability is the accuracy, consistency, and usability of digital systems that support operations—online condition monitoring, analytics platforms, AI models, dashboards, and alerts. 

    The core question is: “Can we trust these insights enough to take real action?”

    Without digital reliability:

    • Teams ignore alarms because of false positives and noisy data, leading to missed critical events.
    • AI recommendations are viewed as “black box suggestions” and side-lined in favour of gut feel.
    • Dashboards remain passive screens instead of embedded decision tools.

    When digital reliability is high:

    • Decisions become faster and more confident because signals are clean, models are validated, and recommendations are actionable.
    • Alert fatigue drops as alerts are prioritized by risk, impact, and time-to-failure.
    • Digital systems demonstrably improve uptime, energy & maintenance cost, and process efficiency.

    How Digital Reliability Is Built

    Reliability teams treat data and analytics with the same rigor as physical assets:

    • Sensor and data quality management: Ensuring correct sensor placement, calibration, timestamping, and health checks to avoid “garbage in, garbage out.”
    • Model explainability: Making sure users can see why an alert was raised (e.g., harmonics pattern, temperature trend vs. historical envelope) and what the likely failure mode is. ​
    • Closed-loop validation: Comparing predicted failures and recommendations against actual outcomes, then retraining models and tuning thresholds for the plant’s specific equipment and duty cycles. ​
    • Workflow integration: Delivering insights into existing maintenance, control room, and production workflows so they trigger work orders, reviews, or operating changes—not just graphs. ​

    Digital reliability in modern plants is powered when your reliability platform can see everything, contextualize it fast, and be trusted almost every single time.

    PlantOSTM does this by continuously ingesting both wired and wireless data streams—covering mechanical signatures (vibration, temperature), electrical behaviour (current, voltage, harmonics), and rich process context (flows, pressures, loads, recipes, setpoints)—into a single model of how the plant actually runs. Within weeks, this equipment and process data is contextualized across lines and systems, so the platform can distinguish whether an emerging issue is mechanical, electrical, or process-induced and prescribe the right action instead of just raising another generic alert.

    Under the hood, PlantOSTM is an industry-trained, agentic industrial AI, trained on more than 85,000 equipment across 50+ asset types. This deep domain training allows it to recognize patterns specific to kilns, mills, fans, compressors, conveyors, and utilities, and to adapt its diagnostics and prescriptions to the way each asset operates in different process conditions.

    On top of this unified data and domain layer, PlantOSTM achieves up to 99.97% prediction accuracy, meaning its anomaly and failure predictions align almost perfectly with real plant behaviour. Because these predictions are coupled with clear, targeted prescriptions—and those prescriptions consistently deliver value—plants see up to 99% prescription adoption rates on critical recommendations. This closes the 99% Trust Loop: high-fidelity predictions, high implementation of recommended actions, and continuous feedback from what actually happened in the field.

    At scale, across 844 plants digitized globally, this trust loop is what turns digital reliability from theory into outcomes. Teams rely on the system to catch mechanical, electrical, and process-induced faults early; they act on the prescriptions because they’ve seen them work; and the platform proves its value in user-validated results—unplanned downtime avoided, throughput sustained or increased, and energy efficiency improved—rather than just in charts and dashboards.

    How the Four Pillars Reinforce Each OtherThese pillars are deeply interconnected on the shop floor:

    Pillar Primary focus Core question answered
    Asset reliability Individual equipment Will this asset fail, and when?
    Plant reliability System performance Will the plant run smoothly end-to-end?
    Production reliability Outcomes Can we reliably hit our plan on downtime, throughput, and energy per ton?
    Digital reliability Data & decisions Can we trust the insights enough to act?

    A few common real-world patterns:

    • A plant can have reliable assets but poor production reliability because bottlenecks, grade-change practices, or unstable utilities create chronic process disturbances.
    • A plant may invest heavily in sensors and dashboards but still suffer low digital reliability; if alerts are noisy or non-actionable, the system will be bypassed, and value is lost.
    • High digital reliability amplifies all other pillars—turning raw asset data into prescriptive actions that stabilize the plant and protect production commitments at lower cost. ​

    For industrial leaders in sectors like steel, cement, mining, paper, chemicals, tires, and food, the path out of firefighting is to treat reliability as a four-pillar discipline: strengthen assets, stabilize the plant, lock in production outcomes, and build digital systems people actually trust and use.

    Read More on Industrial Energy Efficiency