Infinite-Uptime

Blog

  • Six Places Your Customer’s Plant Can’t See

    Six Places Your Customer’s Plant Can’t See

    Six Places Your Customer’s Plant Can’t See

    Read Time: 4 minutes | Author – Chaiitanya Bulusu & Priyanka Gupta Every plant with a monitoring program still gets surprised, and usually by the same six kinds of asset. Here’s why routes and general purpose sensors miss them, and why they make the easiest conversation an integrator can start on site.

    Walk into a plant that already runs a condition monitoring program and ask the reliability engineer which failures caught them out last year. The answer is rarely an asset on the route. It’s the kiln drive nobody could get a clean reading from, the crane that only works in bursts, the fan behind a barrier that can’t be approached while the line is running.

    Those gaps aren’t random. They fall into six patterns, and once you can name them, you can walk a plant with your customer and point at them. That conversation tends to go a lot further than asking whether they’ve thought about AI.

    01. THE SIX BLINDSPOTS

    Where Conventional Monitoring Runs Out

    01

    Too slow

    Kiln girth gears, ladle turrets, slew drives, agitators and stackers turn at
    speeds where bearing and gear defect energy sits at very low frequencies. General purpose
    sensors and short handheld captures struggle to resolve it, so an early defect looks like noise
    until it’s a crack.

    02

    Too fast

    Compressors, blowers, mill drive trains and other high speed machines put
    their useful diagnostic content well above the range a quick route measurement captures. Sample
    too slowly and the early signs of a developing fault never make it into the data at all.

    03

    Too hot

    Around furnaces, kilns, casters and hot rolling lines, the mounting location
    itself can sit above 100 degrees Celsius, with steam, spray and scale on top of that. Standard
    sensors and cabling either drift or fail, so the assets closest to the heat tend to be the least
    instrumented in the plant.

    04

    Intermittent duty

    Cranes, charging cars, presses and anything else that works in bursts spends
    most of the day idle. A timer based measurement mostly records that idling. The fault only shows
    itself under load, which is the exact window a fixed schedule is most likely to miss.

    05

    Hazardous or unreachable areas

    Some assets can’t be approached safely while the line runs, or sit in a
    classified area, or need a permit and a shutdown to reach. The route quietly stops there. The
    gap doesn’t show up as a missing asset on a report, it shows up as a failure nobody saw coming.

    06

    Frequent changeovers

    Paint shops, mixers, extruders and packing lines change speed, load and
    product all day. A baseline set on one condition raises false alarms on the next. After a few
    weeks of nuisance alerts, the plant stops trusting the system, which is worse than not having
    one.

    02. WHAT THE SIX HAVE IN COMMON

    The Measurement Has To Understand The Machine

    None of these are gaps in willingness. Plants know these assets matter. The problem is that a general purpose sensor and a fixed capture schedule don’t know anything about the machine they’re attached to, so they apply the same measurement to a 3 rpm drive and a variable speed extruder.


    Closing the gaps means the capture itself has to be aware of what the asset is doing: measuring when the crane is actually lifting rather than parked, resolving low frequencies on a slow turning gear, surviving the temperature at the mounting point, and holding a baseline that shifts as the line changes product. That’s what physics aware and vertical aware means in practice, and it’s the part of the job most teams underestimate.


    Then comes the second half. A flagged fault still has to reach the plant as something a planner can act on. PlantOS™, the Industrial Outcome Intelligence Engine behind the AI Shield family, has every flagged fault checked by a CAT III or CAT IV vibration analyst before it goes out, and what reaches the plant is a prescription: which asset, what’s wrong, how urgent, and what to do about it. Prediction on its own doesn’t protect a single hour of production.

    A Proven Engine Behind You

    PlantOS™ has unlocked operator validated outcomes across 1,000+ plants in 28 countries and nine heavy-industry verticals, covering exactly these awkward assets: kilns, mills, cranes, furnaces, mixers, extruders and dryers.

    03. HOW TO USE THIS ON SITE

    Three Questions On Your Next Plant Walk

    You don’t need a pitch for this. On your next visit, ask the maintenance manager three things:

    • Which assets aren’t on the route, and why not? The answer is usually one of the six above.
    • What surprised you in the last twelve months? Then check whether that asset was slow, fast, hot, intermittent, hard to reach or constantly changing.
    • What does your team do with an alert today? If the honest answer is a walk-down and a shrug, the gap isn’t sensing. It’s what happens after the alert.

    Those three answers give you the shape of a first project, and they come from your customer rather than from a vendor deck. If you want a second pair of eyes on it, Infinite Uptime will walk one of your plants with you and put the findings into a Reliability Blindspot Audit at no cost, with your team leading the conversation and ours in the room alongside you.

    Stronger Outcomes, Delivered Under Your Name

    Pick one plant where you already know the maintenance manager, and one asset on it that nobody has been able to measure properly. That’s the conversation to bring to the Infinite Uptime partnerships team.

    More in this series:
    How System Integrators Can Deliver Prescriptive Maintenance Without Building It From Scratch.

    Frequently Asked Questions


    What is a plant reliability blindspot?

    It’s an asset a plant cares about but can’t measure properly with the monitoring it has. In practice these fall into six groups: machines that turn too slowly, machines that turn too fast, assets in high temperature areas, equipment that runs intermittently, assets in hazardous or unreachable locations, and lines with frequent changeovers. They are the failures that surprise a plant that already runs a monitoring program.


    Why don’t route based vibration rounds catch low speed failures?

    Because the defect energy on a slow turning gear or bearing sits at very low frequencies, and a short handheld capture with a general purpose sensor struggles to resolve it. The reading looks normal for months. By the time the signal is obvious on a route, the damage is usually well advanced.


    Can vibration monitoring work near furnaces and hot rolling lines?

    Yes, but only with hardware rated for the mounting location rather than the ambient air. Around casters, kilns and hot rolling lines the mounting point can sit above 100 degrees Celsius, with steam, spray and scale as well. Hardware that isn’t built for that either drifts or fails, which is why the hottest assets are often the least instrumented in the plant.


    How do you monitor equipment that only runs in bursts, such as cranes?

    By triggering the measurement on load or speed instead of on a timer. A crane, charging car or press spends most of the day idle, so a fixed schedule mostly records idling. Capturing the moment the asset is actually working is what puts the fault window in the data.


    How do you avoid false alarms on a line with frequent changeovers?

    By judging the machine against its current operating condition rather than one fixed baseline. On paint shops, mixers, extruders and packing lines, speed, load and product change all day, so a single threshold set on one condition raises nuisance alerts on the next. A few weeks of those and the plant stops trusting the system.


    What does a system integrator need to build to offer this?

    Nothing. Infinite Uptime provides the hardware, the AI models and the 24/7 diagnostics. Your team scopes, installs, commissions and services the deployment, keeps the customer relationship, and gets first call on the work the diagnostics generate. Every deal is co-sold, with our team in the room alongside yours.


    What is the Reliability Blindspot Audit?

    It’s a plant walk we run with you at no cost. We go through the site with your customer’s team, identify which assets fall into the six blindspots, and write up what we find. Your team leads the conversation and ours supports it, which usually gives you the shape of a first project in a single visit.

    Exact Sources

    1. “Revised positioning frameworks: six plant reliability blindspots and six-layer plant reliability trust scorecard,” Infinite Uptime, 23 September 2026. Source for the six blindspots and reliability sequence in Sections 01–02. (Internal document.)

    2. “IU Official Boiler Plate.docx,” Infinite Uptime, September 2026. Source for PlantOS™ positioning, key messaging, operator-validated outcomes, and figures of 1,000+ plants, 28 countries and nine heavy-industry verticals. (Internal document.)

    3. “01 – AI Shield Partner System (Deck),” Infinite Uptime, September 2026. Source for partner responsibilities, hardware and AI delivery, 24/7 diagnostics, co-selling and customer ownership. (Internal document.)

    4. Infinite Uptime, Critical Equipment Reliability, verified 30 September 2026. Confirms AI Shield applications across critical heavy-industry equipment.

    5. Infinite Uptime, How System Integrators Can Deliver Prescriptive Maintenance Without Building It From Scratch, September 2026. Source for load-gated capture, temperature-rated mounting and CAT III/CAT IV analyst validation of flagged faults.

    6. “ROT AI Shield Technical Module v1.1,” Infinite Uptime internal documentation. Source for RPM-gated acquisition and the 120°C mounting rating, described as “above 100°C” without naming the product line. (Internal document.)

  • The Install Was Yours. The Annuity Never Was.

    The Install Was Yours. The Annuity Never Was.

    The Install Was Yours. The Annuity Never
    Was.

    Read Time: 6 minutes | Author – Chaiitanya Bulusu Plants want production outcomes now: more uptime, more throughput, lower conversion cost. Integrators install the technology that delivers them, then watch the recurring value go to someone else. Here’s how your next install keeps it on your book.


    Executive Summary

    • Most of the value in a plant technology deployment arrives after commissioning: the subscription, the diagnostics, the service work the findings create, and a renewal every year after that. Integrators usually do the install and get paid once. Everything after it goes to whoever holds the customer’s contract.
    • The AI Shield partner model from Infinite Uptime, the Production Outcomes Partner for Heavy Industries, changes who holds that contract. The customer orders through you. Infinite Uptime provides the hardware, the AI and the 24/7 diagnostics, and every deal is co-sold. You keep a share of the subscription on the order, bill commissioning at your rates, get first call on the work orders the diagnostics produce, and invoice the renewal yourself.
    • Your crews do the same install they always have. The difference is that the plant’s outcomes are delivered under your name, and what comes after the install stays with you.

    It’s 2 a.m. on the third night of a planned shutdown. Your crew is on the mill floor mounting sensors, pulling cable through tray nobody has opened in years, and working through loop checks while the maintenance manager keeps one eye on the clock. By morning the system is live. You close out the punch list, send the invoice and move on to the next bid.

    Over the next ten years, that system will earn money every month. Just not for you.

    Try a quick exercise. Pull up the last ten commissioning jobs your team completed and count how many still pay you anything today. For most integrators the number is zero, or close to it. The software subscription renews with the vendor. The service contract sits with the OEM. The diagnostics, if anyone is doing them, belong to whoever owns the platform. You were the one on the ladder, and you got paid for the ladder.

    01. FOLLOW THE MONEY AFTER GO-LIVE

    Where The Value Actually Sits

    Commissioning happens once. What a typical monitoring system produces after that keeps coming: a subscription the plant pays every year, a stream of findings about what’s going wrong with its equipment, and the maintenance work those findings create. Then there’s the renewal. A plant that has seen a system catch a failure early rarely switches it off, so the renewal ends up as the most valuable line in the deal for whoever holds it.

    Nobody hid this from integrators. Most technology deals have been put together the same way for years. The vendor holds the contract with the end customer, and the integrator comes in as a subcontractor to get hardware onto the asset and data flowing. Once the job is signed off, the integrator’s part is over, even though the integrator is usually the firm the plant trusts most and calls first when something breaks.

    The Question That Decides It

    Who keeps the recurring value comes down to one thing: whose paper the order is written on. Change that, and everything that follows the install changes hands with it.

    02. THE INVERSION

    Same Install, Different Owner Of Everything After It

    The AI Shield partner model starts from that question. The customer places the order through you. You contract with the plant directly, the way you already do for controls work, and Infinite Uptime sits behind you as the intelligence layer. What the plant is buying is protected production: critical assets that keep running, and throughput and conversion cost that hold where they should.

    On site, very little changes. You scope it, install it, commission it and support it, the way you would any project on a critical asset. The difference is what you hold when your crew packs up. Four things come with every deployment:

    • A share of the subscription itself, retained on the order you place rather than paid out to you afterwards, with the terms set down together in writing once the first deal has closed.
    • Commissioning labor, billed at your own rates.
    • Service pull-through. When the diagnostics find a fault, it becomes a work order, and your team gets first call to carry it out.
    • The renewal. You invoice it, and it keeps carrying your share for as long as the subscription stays active.

    The last one matters most. A project book has no memory, but a renewal does. Every deployment you add is still on your book next year and the year after, for as long as the customer keeps running the asset.

    “Every install you’ve ever done became someone’s annuity. Never yours. This is the first install that becomes yours.”

    AI Shield Partner System, Partner Kit, September 2026

    03. WHERE THE WORK ORDERS COME FROM

    Prediction Isn’t An Outcome

    Most monitoring systems generate very little follow-on work for integrators, because they stop at the alert. A value turns red, someone gets an email, and the plant’s own team has to work out what it means. Usually that ends in a walk-down, a shrug and a note to check again next week.

    A prediction on its own doesn’t protect a single hour of production. PlantOS™, the Industrial Outcome Intelligence Engine behind the AI Shield family, carries each finding further. Every flagged fault is checked by a CAT III or CAT IV vibration analyst before it goes out, and what reaches the plant is a prescription: which asset, what’s wrong with it, how urgent it is and what should be done. Each one is aimed at keeping uptime and throughput where the plant needs them. A planner can turn it straight into a work order, and a work order means labor.

    The service reports tell the story better than a pitch can. A steel plant on the US Gulf Coast got 23 days of warning on a developing fault and avoided 72 hours of unplanned downtime. A chemical plant in Alabama had four months’ notice and saved 12 hours. At a steel plant in the Middle East, a single prescription turned into five separate work orders. Each of those jobs is paid work, and under this model the first call goes to you.

    So service pull-through isn’t something your team has to go out and sell. The diagnostics bring the work to you with the reasoning already attached.

    A Proven Engine Behind You

    PlantOS™ has unlocked operator validated outcomes across 1,000+ plants in 28 countries and nine heavy-industry verticals. Your customer won’t be the first site it has been tested on.

    04. HOW THE WORK RUNS

    Co-Sold, Every Deal

    A fair question at this point is who does the selling. You both do. Every deal is co-sold, with Infinite Uptime’s team in the room with yours. Your firm gets a named sales contact plus a backup, and leads you register are picked up within 48 hours. If you can’t make a customer meeting, it gets moved rather than going ahead without you.

    The agreement puts it in three plain lines: we never go around you on your accounts, we never discount your customer, and labor never moves to us. Account protection is earned rather than handed out, so each named account is expected to reach a first order within six months. That keeps the protected list short enough to mean something.

    Getting started is deliberately small: a two page memorandum of understanding with a 30 day exit on either side, and deals already in progress carry on if either side walks away. The first project is chosen against five filters, and the one that matters most is that you already hold the relationship. Skip the biggest plant and the hardest asset. Pick the site where the maintenance manager already takes your calls. The first renewal conversation comes around month 10 to 12, when you both sit down with real numbers.

    05. The Point

    Next Time You’re On The Ladder

    The install was always yours. You have the crews, the site access, the safety record and the trust of the people who run the plant. What you haven’t had is anything that keeps paying once the punch list is closed.

    So the next time your team is on a mill floor at 2 a.m., ask a slightly different question. Whether the job goes well still matters. But ask who will still be delivering outcomes to that plant, and earning from it, five years from now. With the right structure, that can be the people who did the work.

    Stronger Outcomes, Delivered Under Your Name

    Go back to that list of your last ten commissioning jobs and pick the three plants you’d most like to still be earning from. Bring those three to a first conversation with the Infinite Uptime partnerships team.

    New to the model? Start with our earlier piece,
    How System Integrators Can Deliver Prescriptive Maintenance Without Building It From Scratch

  • How System Integrators Can Deliver Prescriptive Maintenance Without Building It From Scratch

    How System Integrators Can Deliver Prescriptive Maintenance Without Building It From Scratch

    How System Integrators Can Deliver Prescriptive Maintenance Without Building It From Scratch

    Read Time: 11–13 minutes | Author – Chaiitanya Bulusu How System Integrators Can Deliver Prescriptive Maintenance Without Building It From Scratch

    The plants you already serve are asking for AI on their critical equipment. This is the version of that offer that keeps the account, the install, and the renewal on your book, without asking you to build a diagnostics practice from zero.


    Executive Summary

    • Your customers are asking for AI on their critical equipment, and a dashboard is not an answer. Getting from a threshold alert to a work order a technician will act on takes ruggedized hardware, load gated capture, a fault model trained across plants, and a 24/7 analyst bench — four fixed costs that sit outside what an integration house is built to do.
    • The AI Shield SI partner program splits that cleanly. Infinite Uptime owns the hardware, the AI and the diagnostics; every deal is co-sold; and the account, 100% of the field and service labor, and the renewal stay on your book, contractually.
    • It starts small and reversible: a two page, non binding memorandum of understanding with a 30 day exit, a first project chosen against five filters, and four ways to earn on a single deployment — none of which resets in January.

    Every January, a lot of system integrators start from zero. The project book empties out over the holidays and fills back in one bid at a time: a PLC upgrade here, an MES rollout there, maybe a SCADA migration if you’re lucky. It’s steady work, but it rarely compounds. Meanwhile, the plants you already serve are asking a version of the same question. Can you do something with AI on our critical equipment? Too often the honest answer stalls at a dashboard. Vibration data streams in, a threshold turns red, an alert fires, and a maintenance team still has to work out whether to trust it and what to do next. That gap, between having data and knowing what to fix and when, is where prescriptive maintenance is supposed to live. It’s also where most SIs stall, not for lack of will, but because building it properly is a different business than the one you run.

    01. The Build Problem

    What “Prescriptive” Actually Requires

    Predictive maintenance and prescriptive maintenance get used interchangeably, and they shouldn’t be. Predictive tells a technician a bearing is trending toward failure. Prescriptive tells them which bearing, what’s wrong with it, how confident the system is, and what the work order should say, validated by a human before it reaches the floor. The difference between the two is most of the engineering effort, and almost none of it plays to a typical integration house’s strengths. 


    THE DIFFERENCE THAT MATTERS

    Where Predictive Stops And Prescriptive Keeps Going

    Same sensor data. Six steps to a work order a technician will actually act on.


    PREDICTIVE
    Stops at Step 02 (Alert only)
    PRESCRIPTIVE
    Goes all six steps through to verified work order


    01
    Signal
    Vibration captured under load

    02
    Alert
    A threshold is crossed

    03
    Diagnosis
    Which bearing, what is wrong

    04
    Confidence
    How sure the model is

    05
    Validation
    CAT III / IV analyst checks it

    06
    Work order
    Named action, named window


    PREDICTIVE  STOPS  HERE

    PRESCRIPTIVE  GOES  ALL  SIX

    Steps 03 to 06 are the engineering — and almost none of it plays to an integration house’s
    strengths.

    Consider what a rotating equipment asset in a hot, wet, continuously loaded environment (a hot strip mill run out table, for example) actually needs to be watched properly. Vibration has to be captured at the exact moment the asset is under load, not on a fixed timer that mostly samples idle running. The hardware has to survive water spray, steam and scale, and be rated to 120°C at the mounting location, without a battery quietly dying six months in. The model behind it needs to be trained on a large cross plant dataset to tell a structural looseness signature apart from a hundred other things that also show up as “vibration went up.” And every flagged fault still needs a human who actually knows rotating equipment, a CAT III or CAT IV vibration analyst, to check it before it becomes a work order. A false positive costs trust you don’t get back. 


    None of that is a weekend project, and it isn’t what a control systems integrator is built to do. The usual workaround, buying some wireless sensors and wiring up a generic anomaly detection package and hoping it’s close enough, burns capital and engineering hours on a capability outside your core business. It still leaves the hardest part unsolved. Nobody wants to staff a night shift of vibration analysts just to validate alerts for one customer’s two cranes. 

    The Honest Tradeoff

    Building a prescriptive maintenance practice in house means carrying hardware R&D, a trained ML pipeline, and a 24/7 analyst bench as fixed costs against uncertain, lumpy project revenue. Partnering means none of those become your fixed costs at all.


    BUILD VS. PARTNER

    What It Takes To Run This In House, Next To What A Partner Already Brings

    Same outcome — a validated work order on a critical asset — reached two different
    ways.


    BUILD IT YOURSELF

    Everything becomes your fixed cost

    • Ruggedized sensor hardware.
      Sourced, qualified and stocked for 24/7 duty in high heat, high vibration zones.
    • A fault classification model.
      Built and continually retrained across enough assets to be trusted.
    • Load or RPM gated acquisition.
      Engineered so faults aren’t missed between idle time samples.
    • A 24/7/365 analyst bench.
      Staffed and rostered to validate every flagged fault before the floor sees it.
    • All of it as overhead.
      Carried against one customer’s subscription, with no cross plant data to lean on.


    PARTNER FOR THE PRODUCT

    You keep the relationship and the labor

    • Hardware, AI and diagnostics.
      Arrive proven, running today across 1,000+ plants in 28 countries.
    • Every deal is co-sold.
      Their team in the room with yours — you never carry the sales motion alone.
    • Account, order, install and commissioning.
      100% of field and service labor stays yours, every time.
    • Findings become work orders.
      You’re the first call executor, not the vendor.
    • Free training and enablement.
      For your engineers and sellers, instead of a hiring problem.
    • The contract renews annually.
      On your book, not the vendor’s.

    02. The Model

    A Partnership Structured To Keep The Account On Your Side Of The Table

    The version of this worth doing isn’t reselling a black box with your logo stapled on it. It’s a straightforward product and service split. The vendor owns the hardware, the AI, and the 24/7 diagnostics. You own the customer relationship, the order, and installation and commissioning: all of the field and service labor, in the agreement, without exception. You stay the single point of contact your customer already trusts. And you never carry the vendor’s sales motion alone: every deal is co-sold, their team in the room with yours. The vendor’s engine runs underneath, but the work order lands with your name on it.


    What makes this credible, rather than another vendor promise, is that the hard engineering is already solved and running. For high frequency protection on critical rotating assets such as cranes, roll lines, and mill drive trains, that’s an AI Shield: purpose built sensor hardware and an always on model tuned to that asset class, with RPM or load gated capture so the fault window actually gets recorded instead of guessed at. And the footprint grows the way an SI’s book grows. You start on one asset class in one plant, extend across the rest of that class as the evidence accumulates, then carry the same construct to the next plant on the same account. You are not betting the relationship on a single trophy asset.


    It also isn’t a first customer’s worth of trust you’re extending. PlantOS™, the platform behind the AI Shield family, is live across more than 1,000 plants in 28 countries, has eliminated over 167,000 hours of unplanned downtime, and holds a 99.97% accuracy rate, user validated. Infinite Uptime’s partner program materials point to throughput gains of up to 2.5% on top of that. Your customer isn’t the pilot.

    Pricing is set case by case, so the thing worth looking at is not a list price but the shape of the return. One deployment pays four ways. The first of them is a share of the subscription itself, retained on the order you place rather than paid out to you afterwards, and the terms of it are set down together, in writing, once the first deal has closed.


    SI ECONOMICS

    Four Ways You Earn On One Deployment

    Pricing is set case by case. What does not change is the shape of the return.


    01

    Subscription share

    A share of the subscription itself, retained on the order you place.

    SHARE OF SUBSCRIPTION

    02

    Commissioning labor

    Installation and commissioning is entirely yours, billed at your own rates.

    YOUR RATE CARD

    03

    Service pull-through

    Every validated finding becomes a work order. You are the first call executor.

    PER FINDING

    04

    Renewal annuity

    The subscription renews annually, and it renews on your book.

    RECURRING

    WHAT RESETS TO ZERO IN JANUARY, ON THIS ACCOUNT
    Nothing

    03. The Guardrails

    What Keeps This Safe To Actually Try

    The reason this is worth a real look, rather than filing it under “vendor pitch,” is that the terms are written to protect the thing you’re actually worried about losing: the account. Three commitments carry it, and they are the same three sentences you will hear in the meeting.


    GUARDRAIL 1

    We never go around you on your accounts.

    Every touchpoint runs through your relationship.


    GUARDRAIL 2

    We never discount your customer.

    Pricing integrity stays with you.


    GUARDRAIL 3

    Labor never moves to us.

    Installation, commissioning and service stay yours, contractually.

    The commercial commitment starts as a two page, non binding memorandum of understanding with a 30 day exit notice. That’s a real test, not a lock in. And the arrangement cuts both ways. If the vendor’s diagnostics quality or co-sell responsiveness falls short of what was promised, you exit clean. 

    04. The First 90 Days

    What Actually Happens After You Sign

    The program deliberately avoids starting with the biggest plant or the hardest asset. A trophy first project tends to fail quietly and expensively. Instead, the first deployment is chosen against five filters: you already hold the relationship, it’s a critical rotating asset, there’s been a known pain point in the last 12 months, the shutdown window is 90 days or less, and there’s a visible, provable win available. If you can name three candidate plants against that list in a first conversation, the next step is obvious. If you can’t name one, the honest answer is to wait. 


    Account protection is earned rather than granted. Each named account is expected to reach a first order within six months, which keeps the protected list short enough to mean something. 


    THE FIRST YEAR

    Day 0 To Month 12, And What Each Step Commits You To

    A two page memorandum of understanding, a 30 day exit notice, and a first project chosen on
    purpose.


    DAY 0
    DAY 0

    Sign the MoU

    Two pages, non binding, 30 day exit notice, scoped to the first deals only.


    DAYS 1–30
    DAYS 1–30

    Enable and select

    Your team is trained. You name the first three candidate projects against the five
    filters.


    DAYS 30–90
    DAYS 30–90

    First deployment

    Ordered through you, at list price, on an account you already hold.


    DAYS 90–180
    DAYS 90–180

    Expand

    Grow the footprint across the asset class, then to the next plant on the account.


    MONTHS 10–12
    MONTHS 10–12

    Renew and review

    Lands with the MoU review. Converts to a full agreement, or both part — accounts
    stay with you.


    ACCOUNT PROTECTION IS EARNED

    Each named account is expected to reach first order within six months.

    “Your customers are asking about AI. A dashboard is not an answer.”

    AI Shield Partner System, Partner Kit, September 2026

    05. The Point

    Why This Actually Fixes The January Problem

    The reset isn’t really about the calendar. It’s that a project based book has no memory. Commission a job, invoice it, and the relationship goes quiet until the next bid comes up. A subscription backed deployment behaves differently. The install is a one time event, but the diagnostics, the service pull-through, and the renewal keep the account active on your book for as long as the customer runs the asset. Start with one plant and two cranes chosen because you already had the trust, and a year from now you’re not rebuilding a pipeline from zero. You’re renewing one. 

    Bring Three Candidate Plants To The First Conversation

    “Infinite Uptime partners don’t just resell technology — they deliver measurable business outcomes using world-class diagnostics and our proven 99% Trust Loop methodology.” System Integrators are named as one of four formal tracks in Infinite Uptime’s partner program, alongside Regional Strategic, OEM, and Operations and Maintenance partners.

    Exact Sources

    1. “01 – AI Shield Partner System (Deck),” Infinite Uptime, September 2026. Internal source for the SI delivery model, co-selling, revenue streams, contractual guardrails, MoU, exit notice, project selection criteria, first-order timeline and partner positioning.

    2. Infinite Uptime, Partners, verified 25 August 2026. Source for the partner outcomes statement, 99% Trust Loop methodology and sales, marketing and technical enablement pillars.

    3. Infinite Uptime, Global Partnership Program and company website. The partnership brochure confirms four partner tracks and throughput gains of up to 2.5%.

    4. Infinite Uptime, About, verified 25 August 2026. Source for company scale, downtime savings and user-validated accuracy figures. Publication check: reconcile conflicting plant, country and downtime figures across the live page, internal content standards and partner materials; verify whether 99.97% refers to accuracy or equipment availability.

    5. “ROT AI Shield Technical Module v1.1” and commercial deck v20, Infinite Uptime. Internal sources for RPM-gated FFT acquisition and the 120°C mounting-location rating. No dedicated public ROT AI Shield page was identified in the supplied source notes; confirm the product name before publication or link to the official website.

    6. Infinite Uptime, Critical Equipment Reliability, verified 25 August 2026. Source for the AI Shield product family and its applications across kilns, mills, cranes, furnaces, mixers, extruders and dryers, including the Crane AI Shield offering.

    Trademark note: Use PlantOS™ with the trademark symbol. AI Shield, ROT AI Shield and Crane AI Shield follow the supplied brand style without it. Verify benchmark figures and the ROT AI Shield product name before publication.

  • The Outcome Gap: Why Most Maintenance Platforms Stop One Level Short of a Result

    The Outcome Gap: Why Most Maintenance Platforms Stop One Level Short of a Result

    The Outcome Gap: Why Most Maintenance Platforms Stop One Level Short of a Result

    Read Time: 11–13 minutes | Author – Rahul Narvekar Dark modern workspace with an office chair, desk, and computer monitor displaying data analytics.

    Sensors, dashboards, integrated views and predictive analytics all tell you what is wrong with a machine. None of them gets it fixed. That difference is the outcome gap, and closing it is the whole job of an outcome-based subscription.


    Key takeaways

    In short: Most industrial monitoring investments stop one level short of a production outcome. An outcome subscription only delivers when it is bought, baselined and reviewed on the production result rather than on platform activity.

    • There is a ceiling built into levels one to four. Describing the machine is not the same as completing a repair and measuring what it returned.
    • The unit of value has to change with the level. A subscription priced on production outcomes cannot be reviewed on sensor uptime and alert counts without losing its own argument.
    • The baseline decides whether value is provable. A figure agreed before installation separates a reported outcome from an argued one.
    • Action rate is the operative metric. Accuracy without execution produces a healthy dashboard and an unchanged production plan.
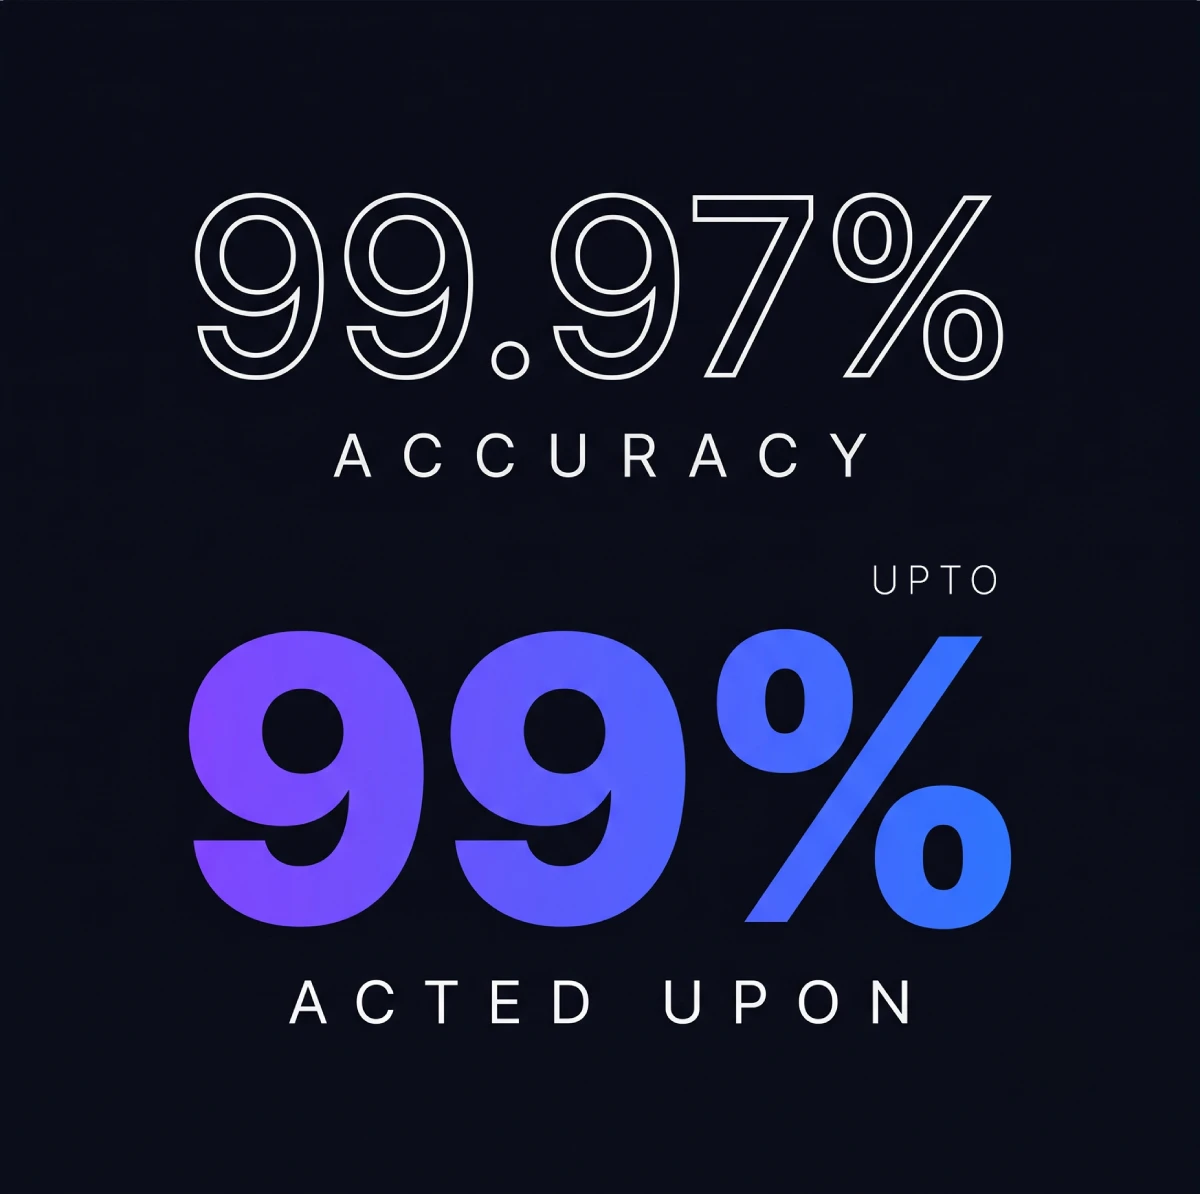
    • Validation compounds. Across the PlantOS™ install base, up to 99 % of prescriptions are acted upon, contributing to 167,837 hours of unplanned downtime saved.

    Two quarters into an outcome-based contract, a plant head is asked what the programme has returned. The answer arrives as a slide showing prediction accuracy, sensor uptime and alerts raised. Every figure on it is accurate. Not one of them is the thing the plant agreed to buy.

    The contract was written against production outcomes.
    The review is being run against platform activity.

    That is rarely a performance problem. It is a level problem, and it starts well before the contract, in how the plant’s monitoring estate was assembled in the first place.

    The five levels, and where most estates stop

    Industrial monitoring gets bought in layers, usually over a decade and usually from different vendors. Each layer solves a real problem and each one leaves the same job unfinished.

    The outcome gap value ladder A four-step numbered staircase rising from sensor data through dashboard visualisation and integrated monitoring in deepening greys to predictive analytics in amber, separated by a dashed red divider marked the outcome gap, from a larger raised green block for production outcomes as a service. The outcome gap 4 Predictive analytics Alerts and generic guidance 3 Integrated monitoring One view, many assets 2 Dashboard visualisation Trends on a screen 1 Sensor data Raw plots and trends 5 Production outcomes Delivered as a service Cause named, not symptom Ranked by plant impact Closed with signoff Priced on hardware, licences and access Priced on outcomes achieved

    The five levels of industrial monitoring. Levels one to four describe the machine. Only level five
    closes a job on the floor and records what it returned.

    Level What it delivers Who turns it into action Where it stops Priced on
    1Sensor data Raw vibration and temperature plots Your reliability engineer A data file Sensors purchased
    2Dashboard
    visualisation
    Trends charted on a screen Your reliability engineer A screen to watch Users or tags
    3Integrated
    monitoring
    One view across assets and sites Your engineer, plus analysts A consolidated view Assets connected
    4Predictive
    analytics
    Anomaly detection and generic guidance Your team, still interpreting An alert to interpret Assets monitored
    The outcome gap
    Everything above describes the machine. None of it closes a job on the floor.
    5Production Outcomes as a Service A named fault, its cause and the fix Issued as a prescription, validated by the plant A closed job and a recorded outcome Production outcomes achieved

    Levels one to four are not failures. A plant at level four has genuine capability, and it detects degradation earlier than a plant at level two. What it does not have is a mechanism that converts detection into a completed repair and a measured production result. That conversion is the outcome gap.


    Closing it takes three things. First, the fault gets named with its cause rather than described as a symptom. Then the job is ranked by what stopping that asset costs in production. Finally, the work closes on the floor with a signoff recording what was actually found.


    An outcome-based subscription puts all three under one contract, with the provider measured on whether they happen. The six requirements below decide whether that works in practice.

    REQUIREMENT 01

    The outcome is written in production units before anything is installed

    A subscription that promises improved reliability has promised nothing measurable. A subscription that promises a reduction in unplanned downtime hours on Line 3, measured against the trailing twelve months, has created something both parties can audit at any point.


    Level 4 Ceiling

    Platform metrics

    What a level-four review reports


    • Prediction accuracy

    • Sensor uptime

    • Alerts raised

    • Assets monitored

    • Dashboard logins


    Level 5 Outcomes

    Production units

    What the contract should be written in


    • Unplanned downtime hours avoided

    • Throughput on a defined line

    • Maintenance cost movement

    • Cost per tonne

    • Prescriptions closed on the floor

    Production units also settle the internal argument that follows. Finance recognises tonnes and cost per tonne. Operations recognises downtime hours and throughput. Neither recognises anomaly counts, which is why programmes reported in level-four metrics tend to lose their budget sponsor by year two even when they are performing well.

    REQUIREMENT 02

    The baseline is agreed while it is still uncomfortable to agree it

    Baselines are easy to set before go-live and nearly impossible to set afterwards. Once prescriptions are flowing and hours are being saved, every historical figure becomes contested, and the value delivered turns into a negotiation rather than a record.


    A workable baseline needs a defined period, usually the trailing twelve months, a defined source such as the CMMS breakdown log or the production stoppage register, and a named owner on the plant side who signs that the number is correct. Plants that skip this step often deliver strong results and still cannot prove them, which is a harder problem to fix than underperformance.


    Where historical logging is thin, agree a short instrumented baseline window rather than reconstructing one. Two months of clean measurement outperforms two years of inconsistent records.

    REQUIREMENT 03

    The scope reaches past the critical few

    Most subscriptions open on a shortlist of critical rotating assets, which is sensible for a proof phase and limiting as a permanent boundary. Recurring stoppages in a heavy plant rarely sit only on the twelve assets everyone already watches. They accumulate across balance of plant equipment, on the pumps, fans, blowers, compressors, conveyors and gearboxes excluded because each one individually looked too small to instrument.


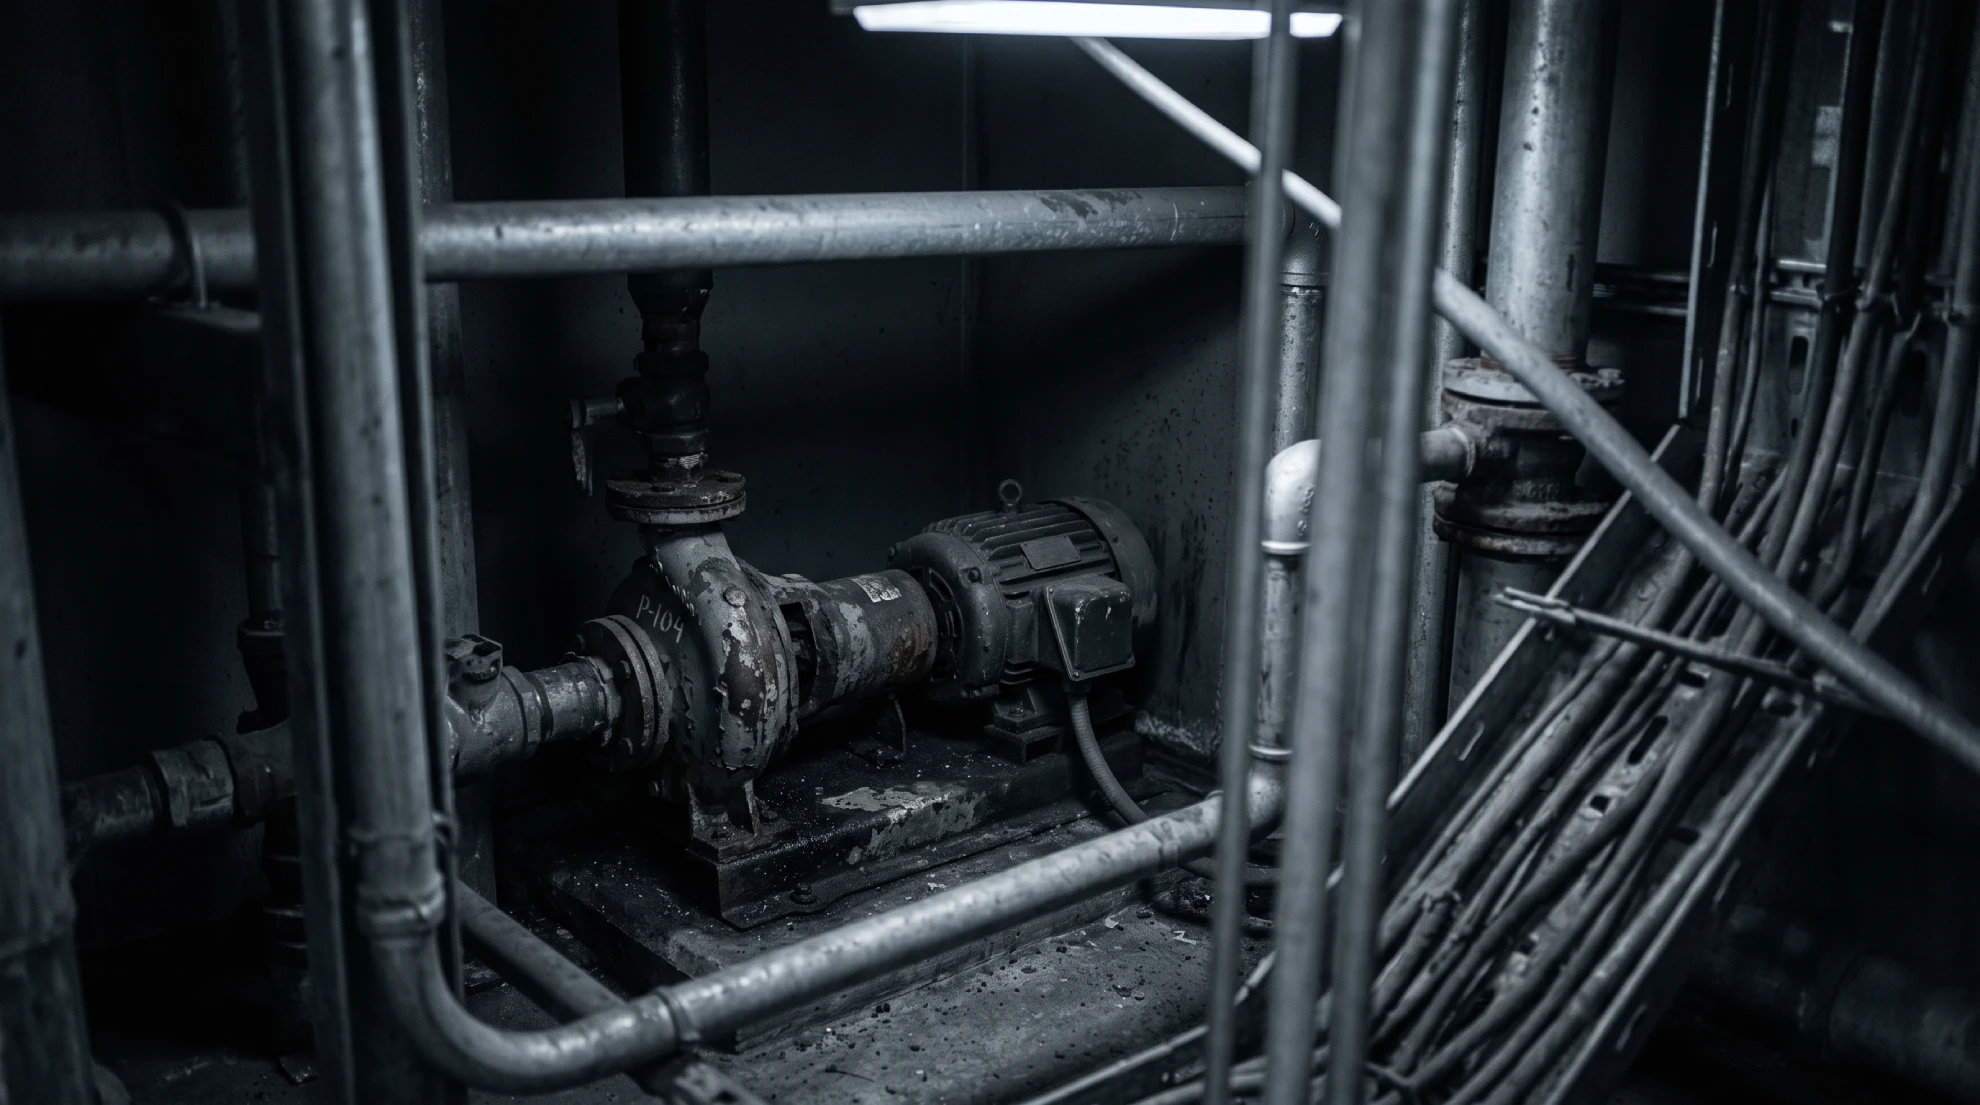
    Industrial pump and motor surrounded by pipes and equipment in a plant environment.
    The recurring stoppages accumulate on the assets nobody instrumented, because each one individually looked too small to bother with.

    Coverage is what converts a pilot into a plant-level outcome. Infinite Uptime’s PlantOS™ addresses this through self-powered wireless sensing that installs without gateways or plant cabling, so extending scope does not require a shutdown or a capex cycle. The commercial consequence matters more than the technical one, since a subscription that can widen its asset base can keep growing its outcome, while a fixed twelve-asset fence cannot.

    REQUIREMENT 04

    The prescription reaches the floor as an instruction

    This is the step that separates level five from level four, and it is more procedural than technical.


    Gloved worker holding a smartphone displaying a maintenance instruction
    A prescription reaches the person who can act on it, on the floor, rather than waiting on a screen for someone to interpret.

    A level-four alert says an asset is deviating and attaches a recommendation for someone to interpret. A prescription names the fault and its cause, states the corrective action, carries a severity and urgency rating so it can be ranked against every other open job, and reaches the operator on dashboard, email and mobile. The plant decides when to schedule it, because scheduling belongs to the people who own the production plan. What the platform removes is the interpretation step, not the plant’s authority over its own shutdown windows.


    The prescription then closes with a digital signoff recording what was actually performed, with field evidence attached. Track this as action rate, meaning the percentage of issued prescriptions executed on the floor. A platform with high accuracy and a low action rate has an adoption problem rather than a modelling problem, and adoption problems are solved with workflow and governance rather than with better algorithms.

    REQUIREMENT 05

    Process data is inside the subscription boundary

    Vibration data tells you what is happening to the machine. It does not tell you why.


    Industrial process equipment with a large cylindrical vessel in a dark manufacturing facility
    The operating condition that damages the machine often sits outside it, in process data that vibration alone cannot see.

    Take a cement kiln main drive. The pinion bearing shows rising acceleration and a clear spectral peak, so the diagnosis is bearing degradation and the corrective action is relubrication. The work gets done and the trend flattens. Six weeks later it climbs again, because the actual driver was a coating buildup in the kiln that shifted load distribution across the girth gear. Vibration described the damage correctly every time. It could not name the operating condition creating the damage, because that condition lives in the process data.


    This is the practical ceiling of a vibration-only scope, and it is why level four stops where it does. Mechanical signals are excellent at identifying which component is degrading and how fast. Process signals from the PLC and historian, covering feed rate, temperature profile, load, tension and pressure, are what explain the cause. A fault described by its symptom produces an investigation. A fault explained by its cause produces a corrective action, which is the only version that closes.

    REQUIREMENT 06

    The operator validates the outcome, and the validation is the deliverable

    Every prescription closes with a person on the floor recording what was found and what was done. That closure carries weight in two directions, which is why it belongs at the centre of the contract rather than at the end of the workflow.


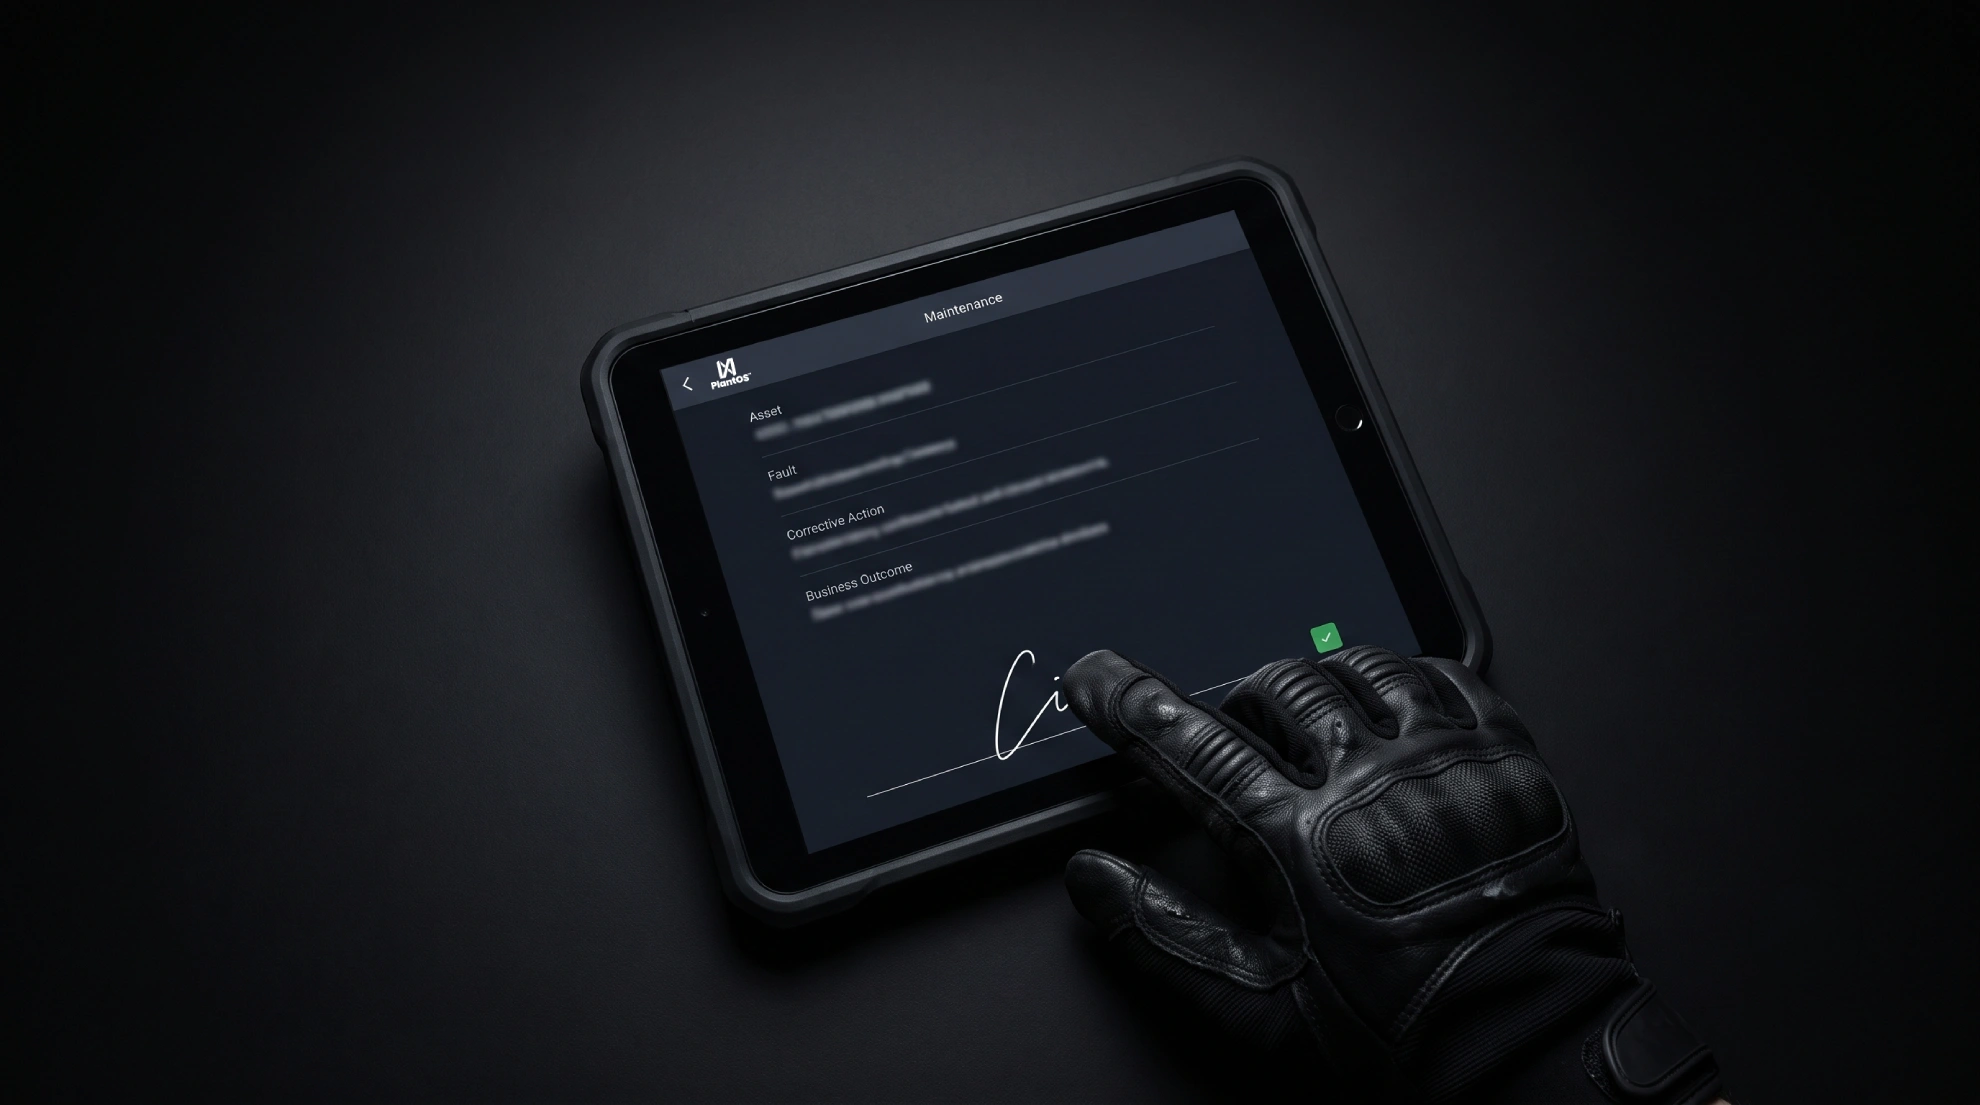
    The operator validates the outcome, and the validation is the deliverable
    Asset, fault, corrective action and business outcome, closed with a signature from the person who did the work.

    On the plant side, it is the proof. An outcome validated and signed by the customer’s own reliability and operations teams survives a budget review in a way that a provider-reported figure never does. It also settles the accuracy question honestly, because the judgement on whether a diagnosis held is made by the people who opened the machine rather than by the model that issued it. Sustaining this needs very little ceremony: a named owner on each side, a weekly touchpoint to clear open prescriptions, a monthly review of action rate and closure time, and a quarterly reconciliation against baseline.


    On the model side, that same signoff is training data. When an engineer writes back what was actually found, including detail the platform did not previously hold, that note becomes a labelled outcome drawn from your assets, your operating conditions and your failure history. PlantOS™ formalises this as the 99% Trust Loop: accuracy builds trust, trust drives action, action produces validated feedback, and feedback sharpens the next prescription.


    The commercial implication is worth negotiating for. A subscription running on validated feedback is worth more in year three than in year one, which argues for multi-year terms with scope expansion built in rather than annual renewals holding coverage flat.

    THE SHAPE OF IT

    What the first six months look like

    A subscription set up against these requirements follows a recognisable rhythm. Nothing here is exotic, and each stage works because the one before it was defined properly.


    0
    Day 0
    Baseline and scope locked

    1
    Week 2
    First prescription issued

    2
    Weeks 3–12
    Action rate becomes the metric

    3
    Day 90
    Outcome checkpoint

    4
    Month 6
    Audited return

    9X

    ROI reported by a cement producer running Infinite Uptime’s PlantOS™, verified within six months against their own pre-subscription baseline by their reliability and operations teams.

    Programmes that skip the early stages often still deliver a real result. What they cannot do is prove it, which at renewal amounts to the same thing.

    THE PROOF

    What level five returns at scale


    1,000

    plants live on PlantOS™


    28

    countries


    99.97%

    prediction accuracy


    167,837

    downtime hours saved


    *Note – Data as of August 06, 2026  
    Source – PlantOS™ Digital Reporting System – User-validated True Positives & False Negative Rate

    Up to 99 % of prescriptions are acted upon. Customers report up to 10 % lower maintenance cost and up to 2.5 % higher throughput, with every figure signed off by their own reliability and operations teams. Hindustan Zinc Ltd of Vedanta Group reported over $700K in savings as published by Vedanta Spark, while JSW Steel runs the platform across 139 plants and Coromandel International across 27.


    Start Here

    Define the outcome, agree the baseline, and let the first quarter prove it.

    Start with your most critical line.


    Try PlantOS™

    Frequently Asked Questions


    What does outcome-based mean in a maintenance contract?

    The provider is measured and paid against a production result rather than against software access, sensor count or reports delivered. Contracted metrics are typically unplanned downtime hours avoided, throughput change on a defined line, maintenance cost movement and cost per tonne. Infinite Uptime markets this model as Production Outcomes as a Service, delivered through Infinite Uptime’s PlantOS™.


    What is the difference between predictive maintenance and prescriptive maintenance?

    Predictive maintenance detects that an asset is degrading and estimates when it may fail. Prescriptive maintenance names the fault and its cause by reading equipment and process data together, states the corrective action, ranks it by production impact, and closes it with an operator signoff. The practical difference is that a prediction still needs interpretation, while a prescription is already an instruction.


    Which companies offer outcome-based maintenance subscriptions?

    Providers fall into four groups: sensor manufacturers selling hardware with an analytics layer, CMMS vendors adding condition modules, general industrial IoT platforms, and vertical prescriptive AI providers that contract against production outcomes. Infinite Uptime sits in the last group, operating PlantOS™ across 1,000 plants in 28 countries with outcomes validated by each customer’s own operations team.


    How soon does an outcome-based maintenance programme show results?

    The first fault prescription is typically issued within two weeks of installation, with a structured 90-day path to measurable production outcomes. Three things set that pace: how quickly sensing can be commissioned across the asset scope, how quickly equipment and process data are brought together so faults can be explained rather than only flagged, and whether prescriptions close on the floor once they start arriving. Commissioning needs no shutdown, so the measurement window opens immediately rather than at the next planned outage, and the 90-day checkpoint reconciles hours saved against the baseline agreed at Day 0.


    Does this model work in older brownfield plants?

    Yes, and brownfield sites often see faster returns because their unplanned stoppage history provides a clear baseline to measure against. Mixed-vintage assets and multi-vendor sensor estates are handled at the analytics layer rather than by standardising hardware, so existing instrumentation does not have to be replaced first.


    Which industries use outcome-based maintenance subscriptions?

    Heavy continuous-process manufacturing, where an hour of unplanned downtime carries a large production value. PlantOS™ operates across cement, steel, mining, tyre and rubber, chemicals, paper and pulp, food and beverage, pharmaceuticals, and energy. JSW Steel runs the platform across 139 plants and Coromandel International across 27.


    How are the reported savings verified rather than estimated?

    Each prescription closes with an operator signoff recording what was performed, with field photographs attached, and states the downtime hours saved on the document itself at the time of closure. Those records reconcile against the pre-agreed baseline, and the customer’s own reliability and operations teams sign off the final figures. Across the install base this has accumulated to 167,837 hours of unplanned downtime saved.

  • How Prescriptive AI Cuts Plant Downtime

    How Prescriptive AI Cuts Plant Downtime

    How Prescriptive AI Cuts Plant Downtime

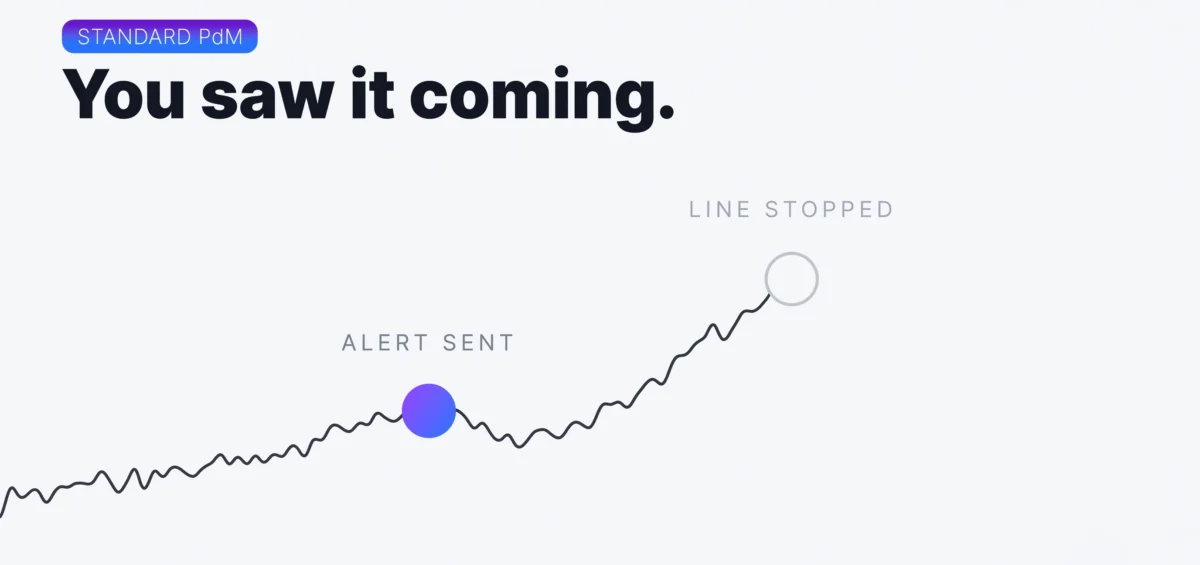
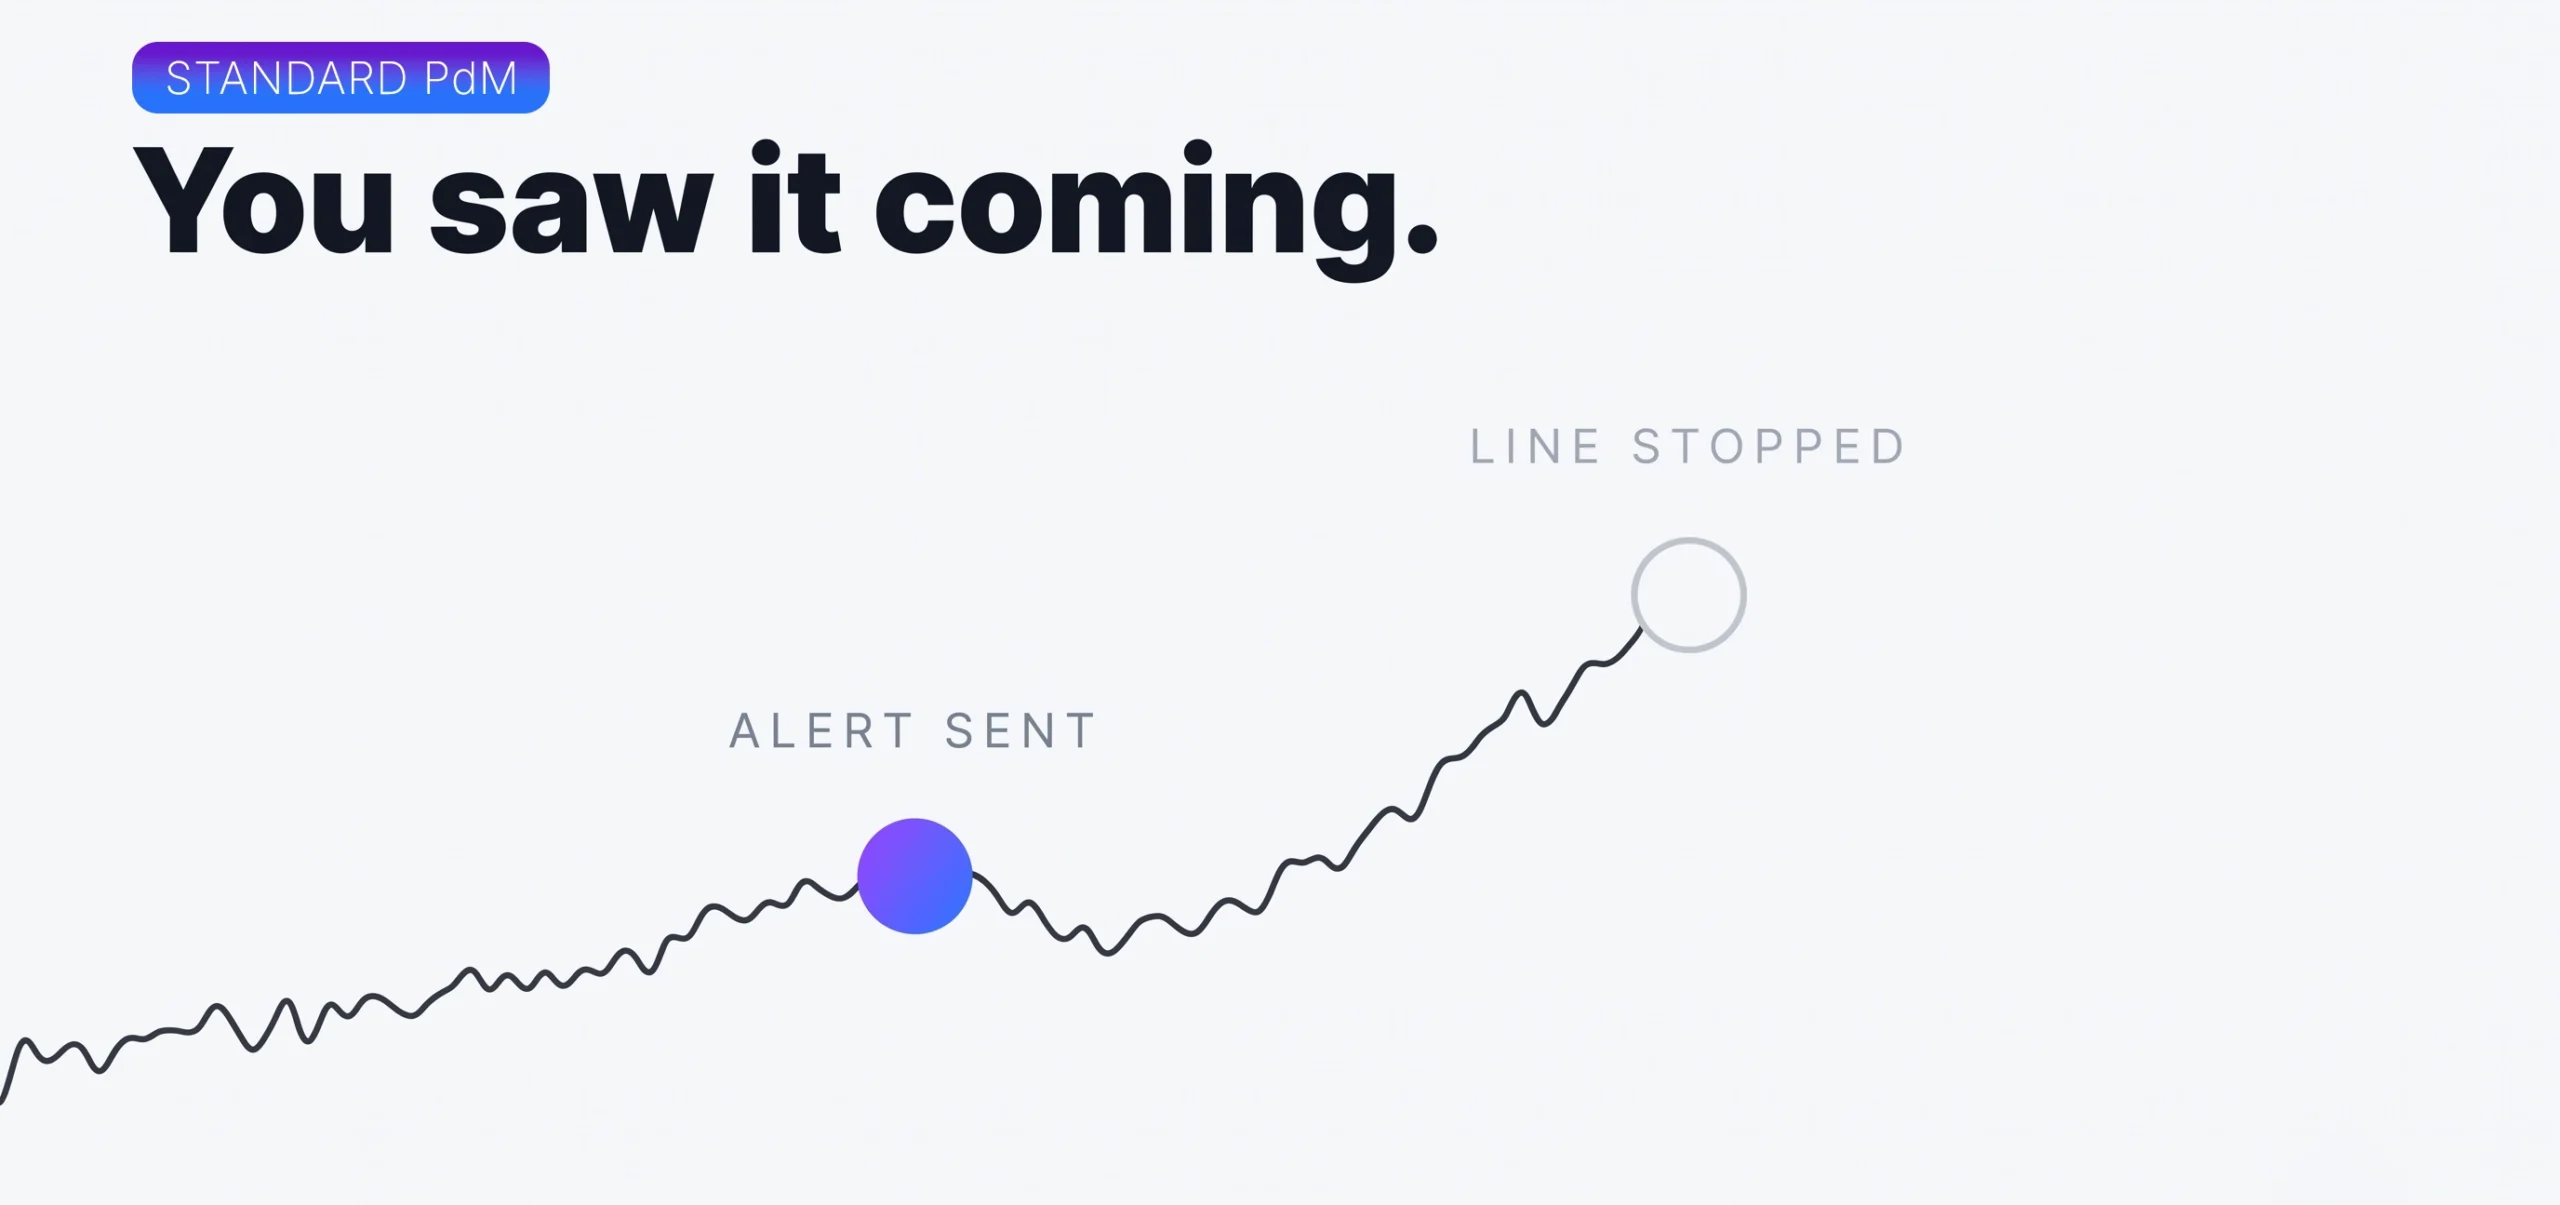
    Read Time: 11–13 minutes | Author – Rahul Narvekar Standard PdM equipment condition trend showing an alert before a line stoppage, illustrating how Prescriptive AI can diagnose faults and prioritize maintenance actions to prevent unplanned plant downtime.


    Key Takeaways

    In short: Detection alone does not recover downtime hours.
    Prescriptive AI cuts unplanned downtime by compressing the interval between
    a fault appearing on an asset and a corrective job being completed on the floor.

    • Downtime is a delay problem, not only a detection problem.
      Most lost hours accumulate after the anomaly is already visible, inside diagnosis,
      prioritization and scheduling.
    • Process data completes the diagnosis.
      Reading PLC and historian signals alongside vibration exposes the operating condition
      driving the fault, not just the symptom.
    • Prioritization protects the production plan.
      Faults are ranked by production impact, so the critical line is defended before the standby pump is.
    • The instruction reaches the person who can act.
      A prescription carries a named action and a deadline, and it closes with a digital signoff
      rather than a risk chart.
    • Validated outcomes compound.
      Across the PlantOS™ install base, up to 99 % of prescriptions are acted upon,
      contributing to 167,837 hours of unplanned downtime saved.

    Ask a reliability engineer why a critical asset stopped last quarter and the answer is rarely
    that nothing was seen. Something was seen. A vibration reading drifted, an alert was raised,
    a screenshot went into a WhatsApp group, and the job was scheduled for the next planned window
    that arrived too late.

    The hours were not lost at detection. They were lost in everything that followed.

    Prescriptive maintenance solutions

    attack that interval directly. Here is how Prescriptive AI
    converts equipment and process data into prioritized maintenance actions, and where each stage
    removes downtime hours from the plant.

    Where the downtime hours actually go

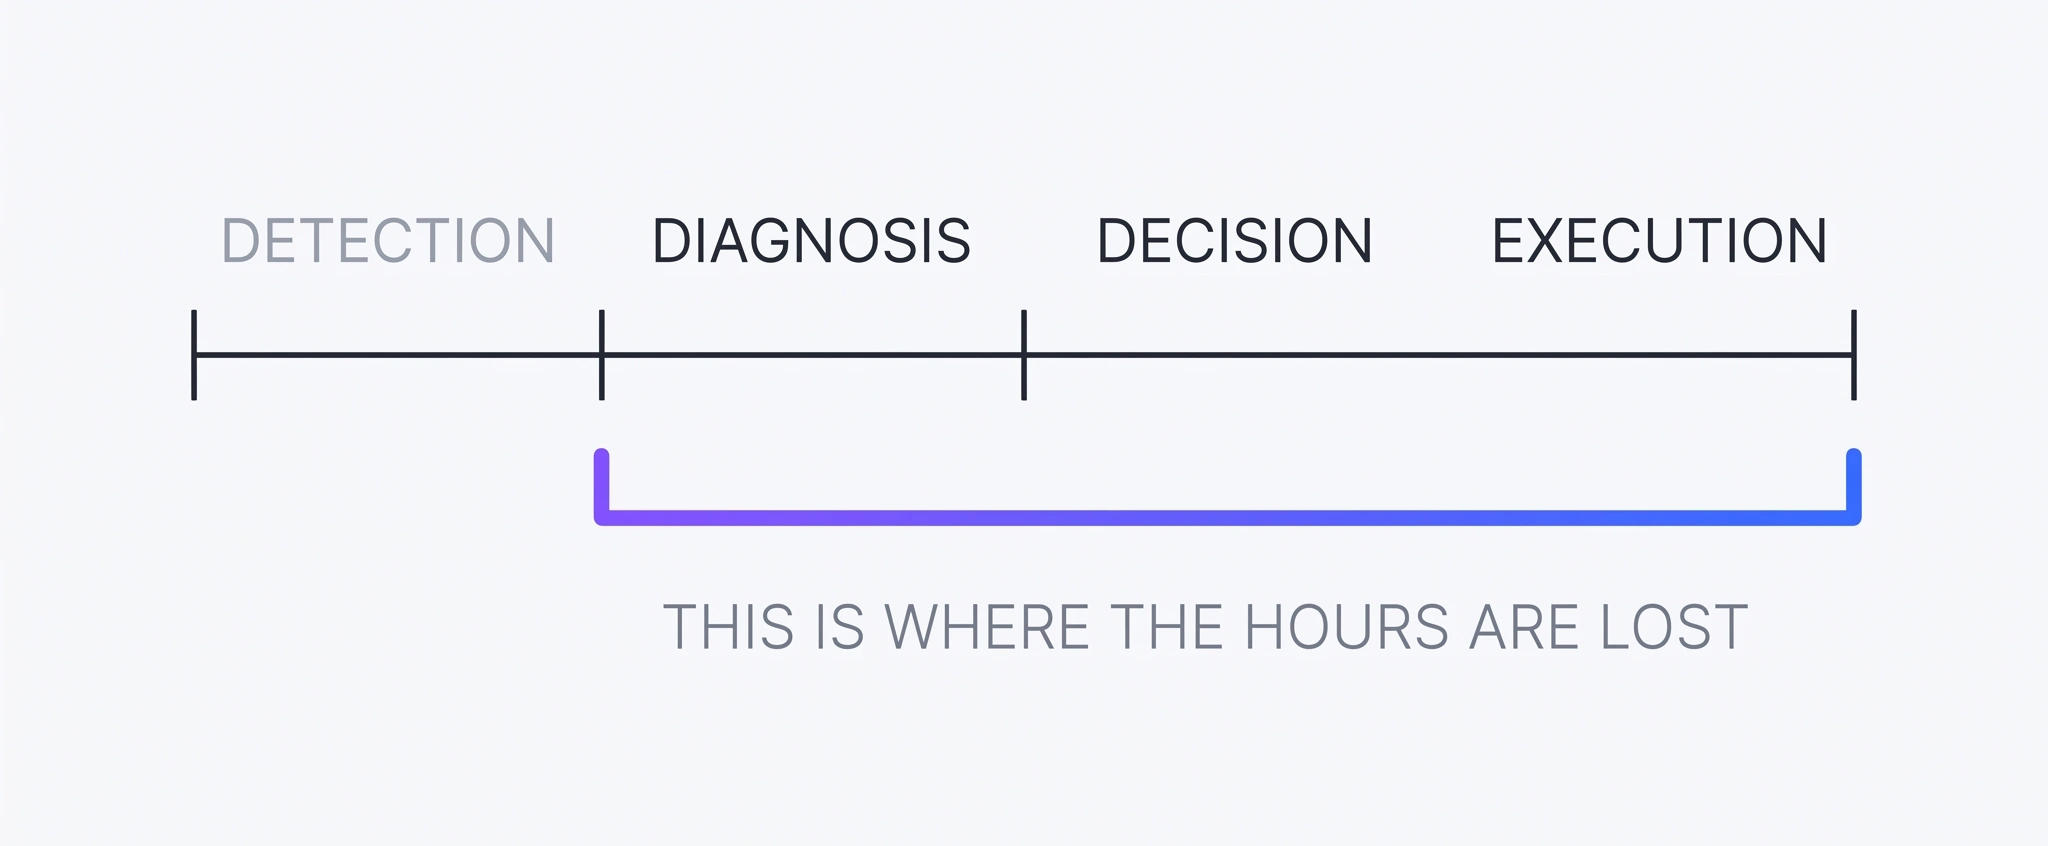
    Unplanned downtime is the sum of four intervals, and only the first belongs to detection.


    The detection lag is the time between degradation starting and the system noticing. Condition monitoring already handles this well. The diagnosis lag is the time between noticing and knowing what is wrong, which usually depends on one experienced engineer finding time to read a waveform. The decision lag is the time between knowing and agreeing that this job outranks the other fourteen open jobs. Finally, the execution lag covers work order creation, spares availability, and closure on the floor.


    Prescriptive AI downtime timeline showing detection, diagnosis, decision, and execution gaps
    Only the first interval belongs to detection

    A predictive programme compresses the first interval and hands the other three back to your team. That is why plants with mature sensor coverage still report breakdowns. Detection was never the bottleneck. Everything downstream of it was.

    1. It reads the process, so the diagnosis does not stall

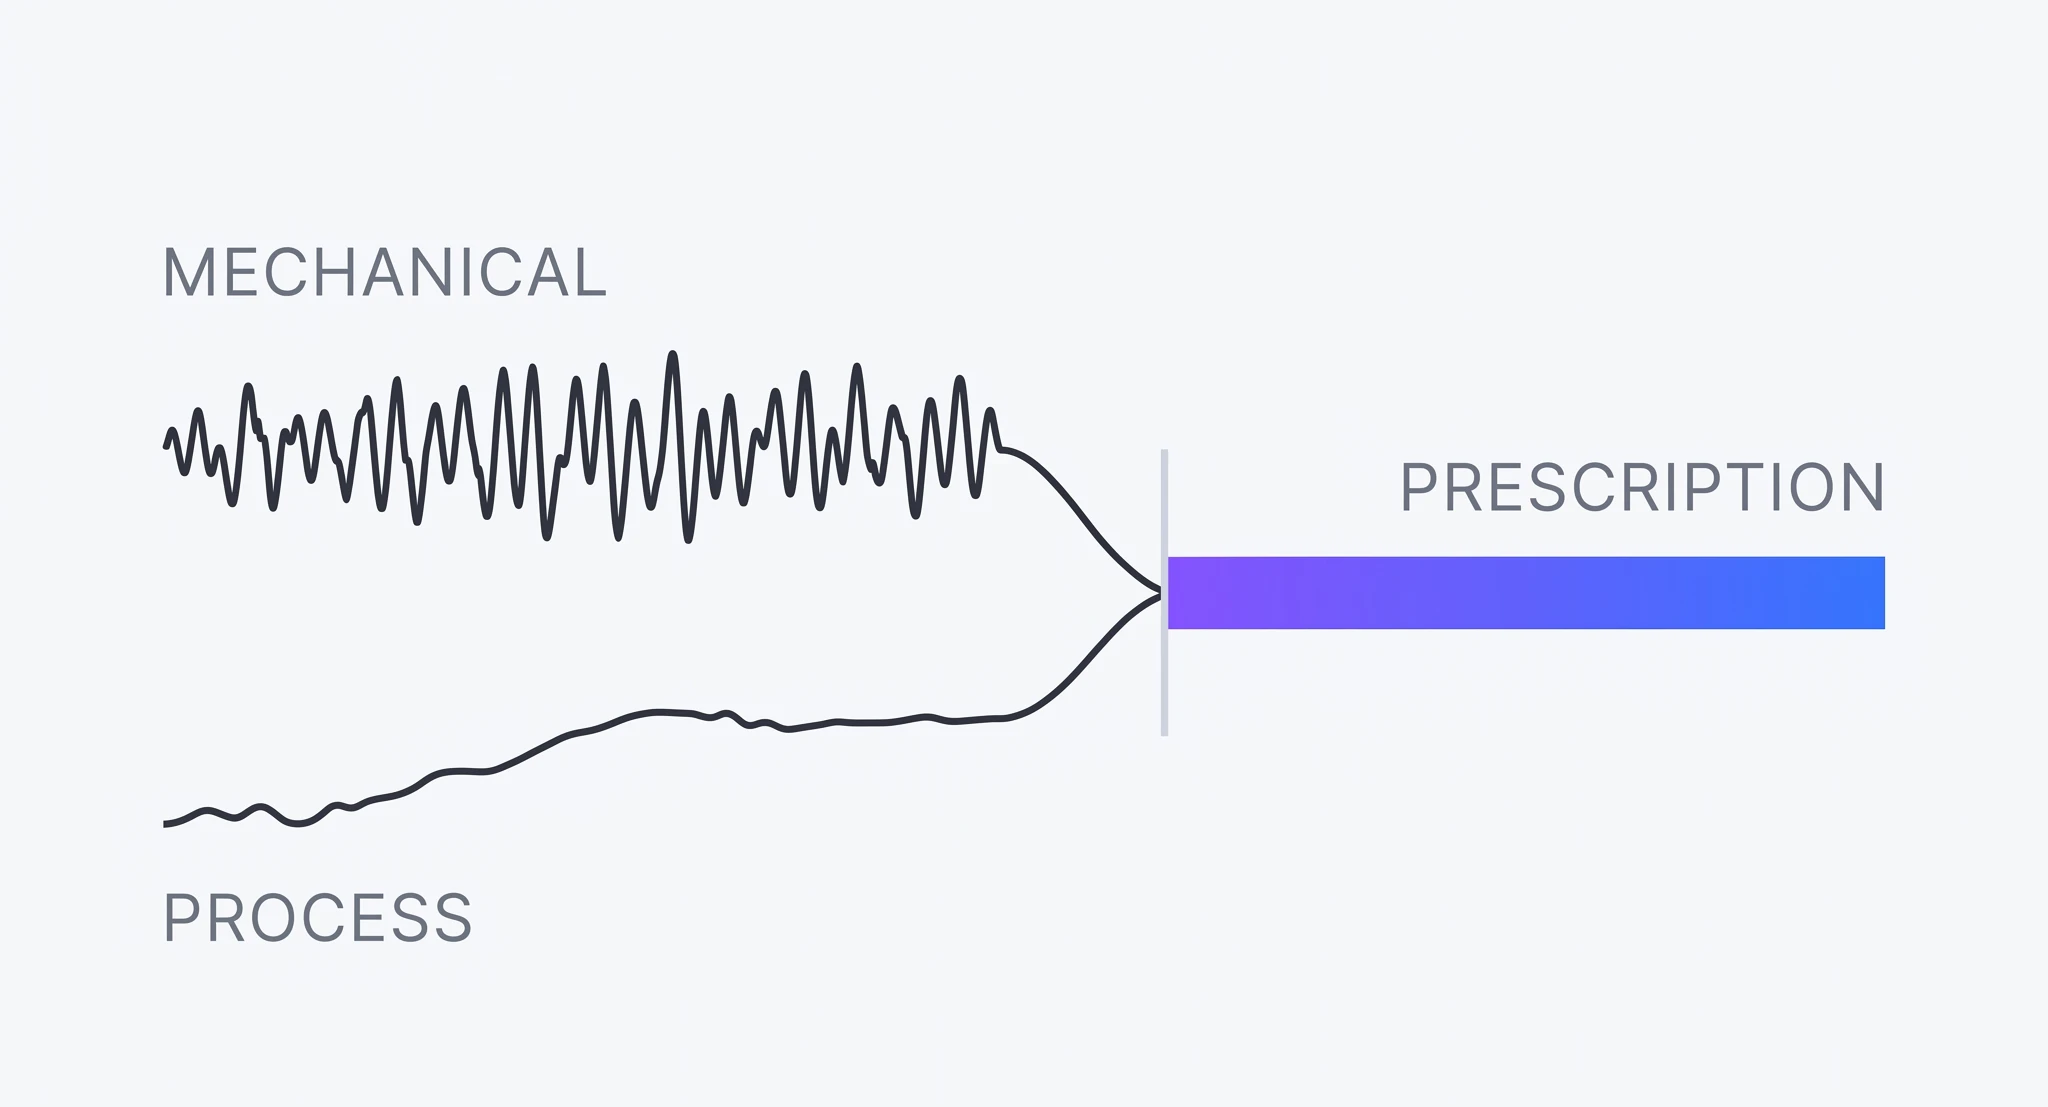
    Mechanical fault signatures explain only part of what actually fails on a heavy plant. A large share of mechanical damage is induced from outside the machine by kiln ring formation, thermal overstress, cyclone coating buildup, ladle heat profile drift, or web tension drift. These conditions degrade the asset well before a clean mechanical signature appears.


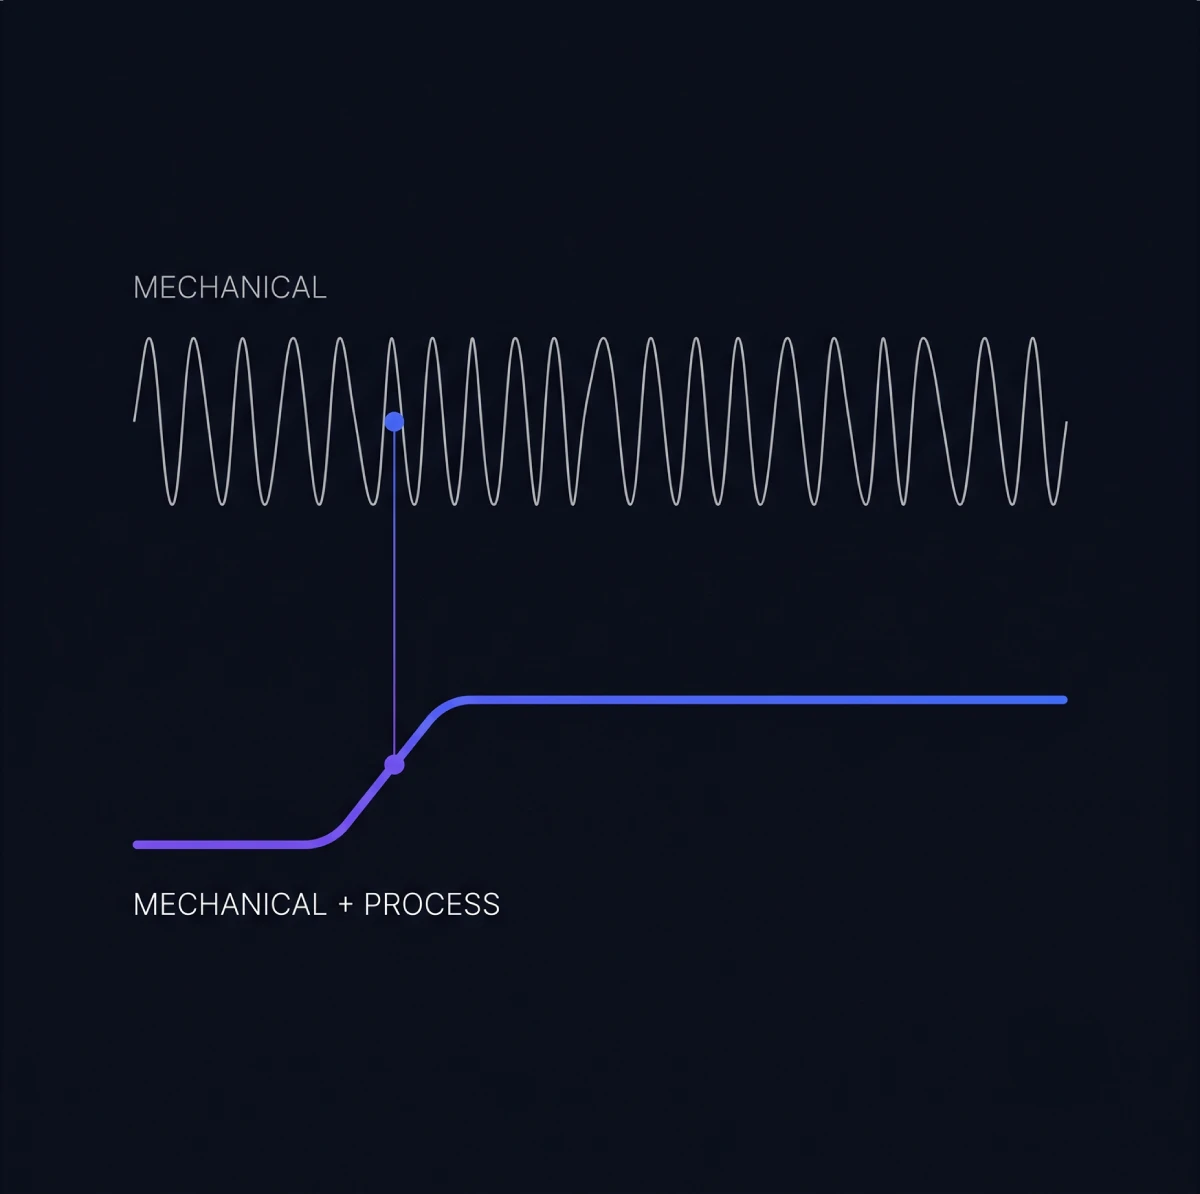
    Prescriptive AI combining mechanical and process data to diagnose industrial equipment faults
    Two streams in, one instruction out

    Prescriptive AI contextualizes equipment data alongside process data from the PLC and historian. The fault is explained by its cause rather than described by its symptom, which is what allows a diagnosis to be issued automatically instead of queued for interpretation. Diagnosis lag drops from days to the length of a shift handover.

    2. It names the fault mode, so the right job gets raised

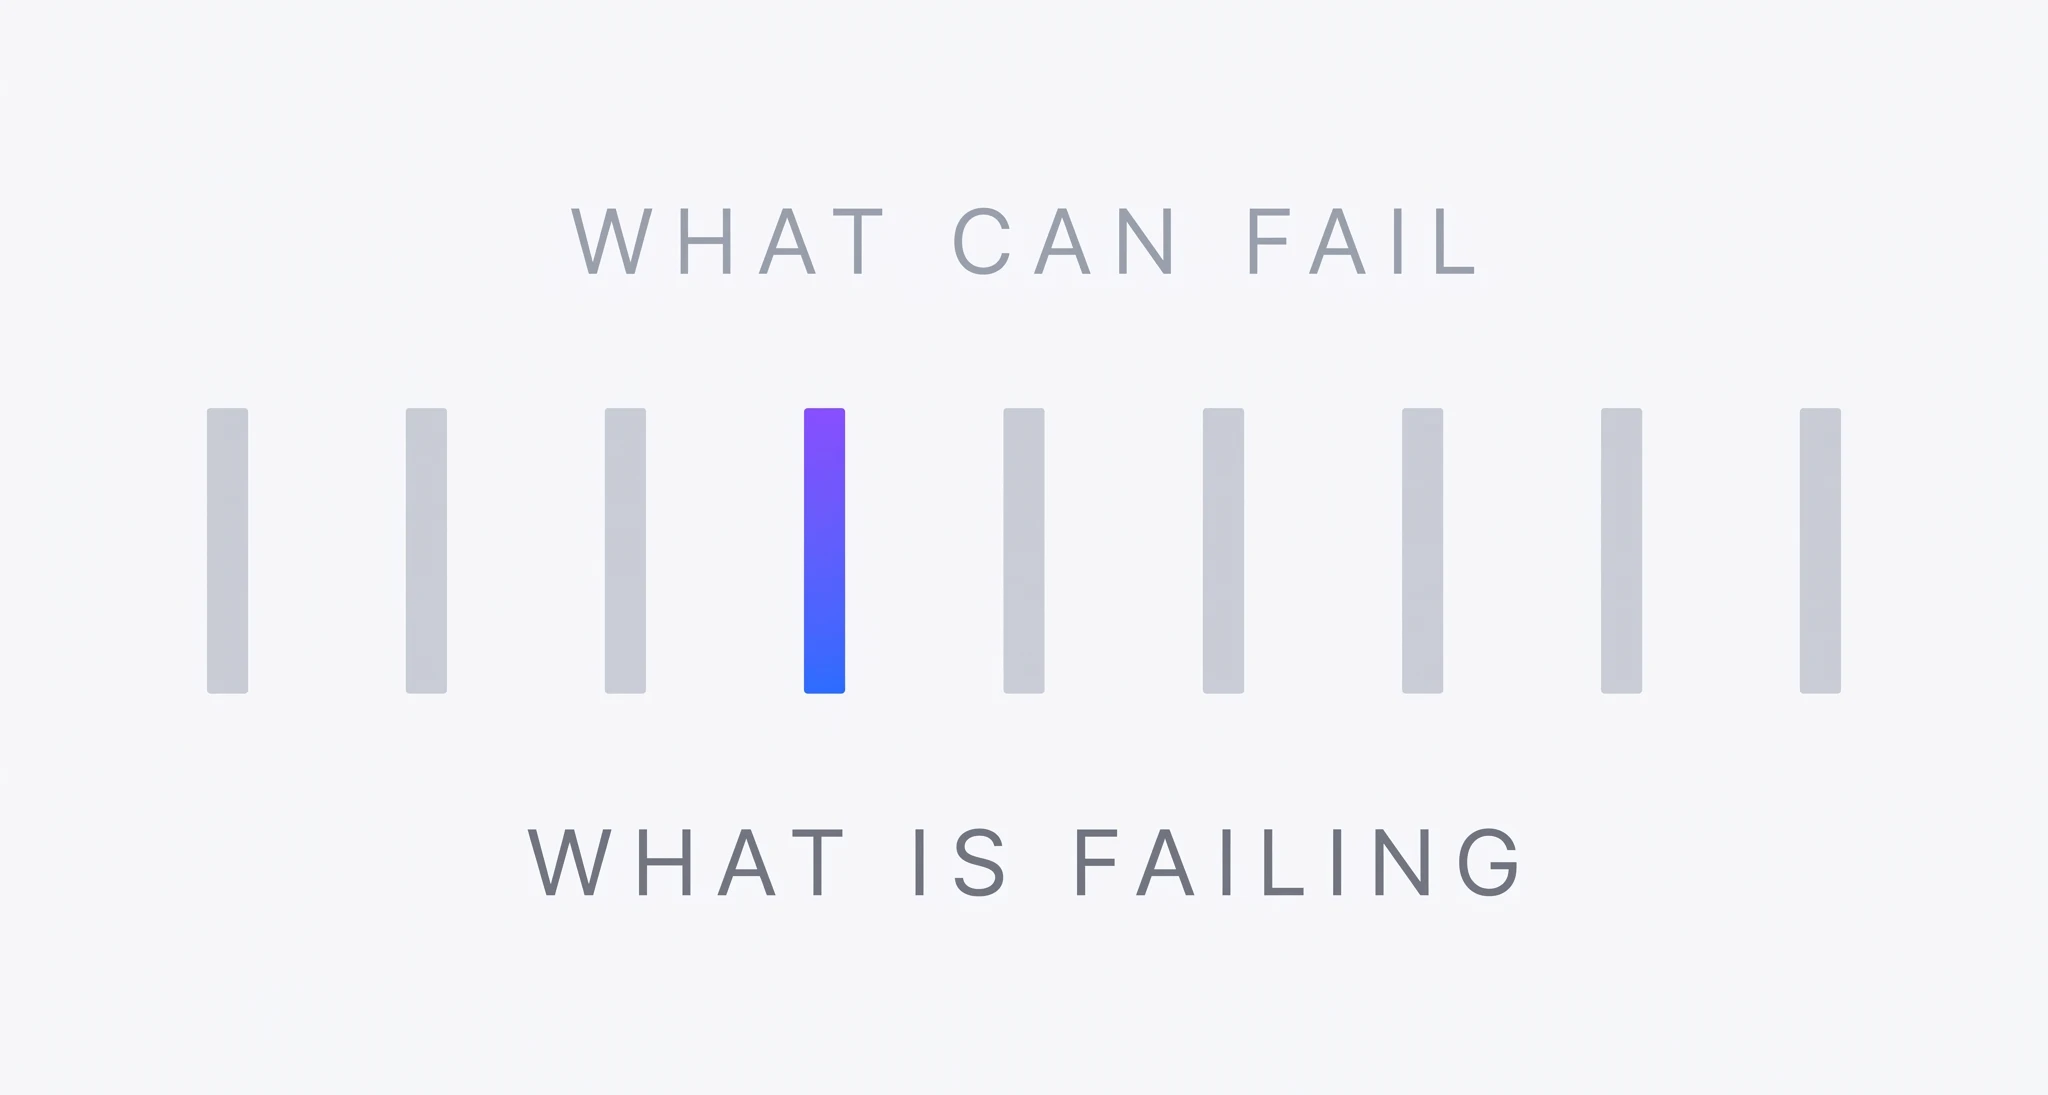
    A general anomaly model finds deviation on a mill. An equipment-specific model names gear-mesh backlash and links it to the load condition that caused it. That distinction decides whether the resulting work order fixes the failure or replaces a healthy component while the real fault keeps developing.


    Prescriptive AI identifies specific equipment fault modes to generate the right maintenance work order
    A known taxonomy, and the one mode developing today

    Infinite Uptime’s PlantOS™ delivers this through AI Shields, equipment-specific models built on Dynamic FMEA for kilns, mills, cranes, furnaces, mixers, extruders and dryers. Naming the fault mode removes the rework loop, and rework is downtime counted twice.

    3. It ranks by production impact, so the critical line is defended first

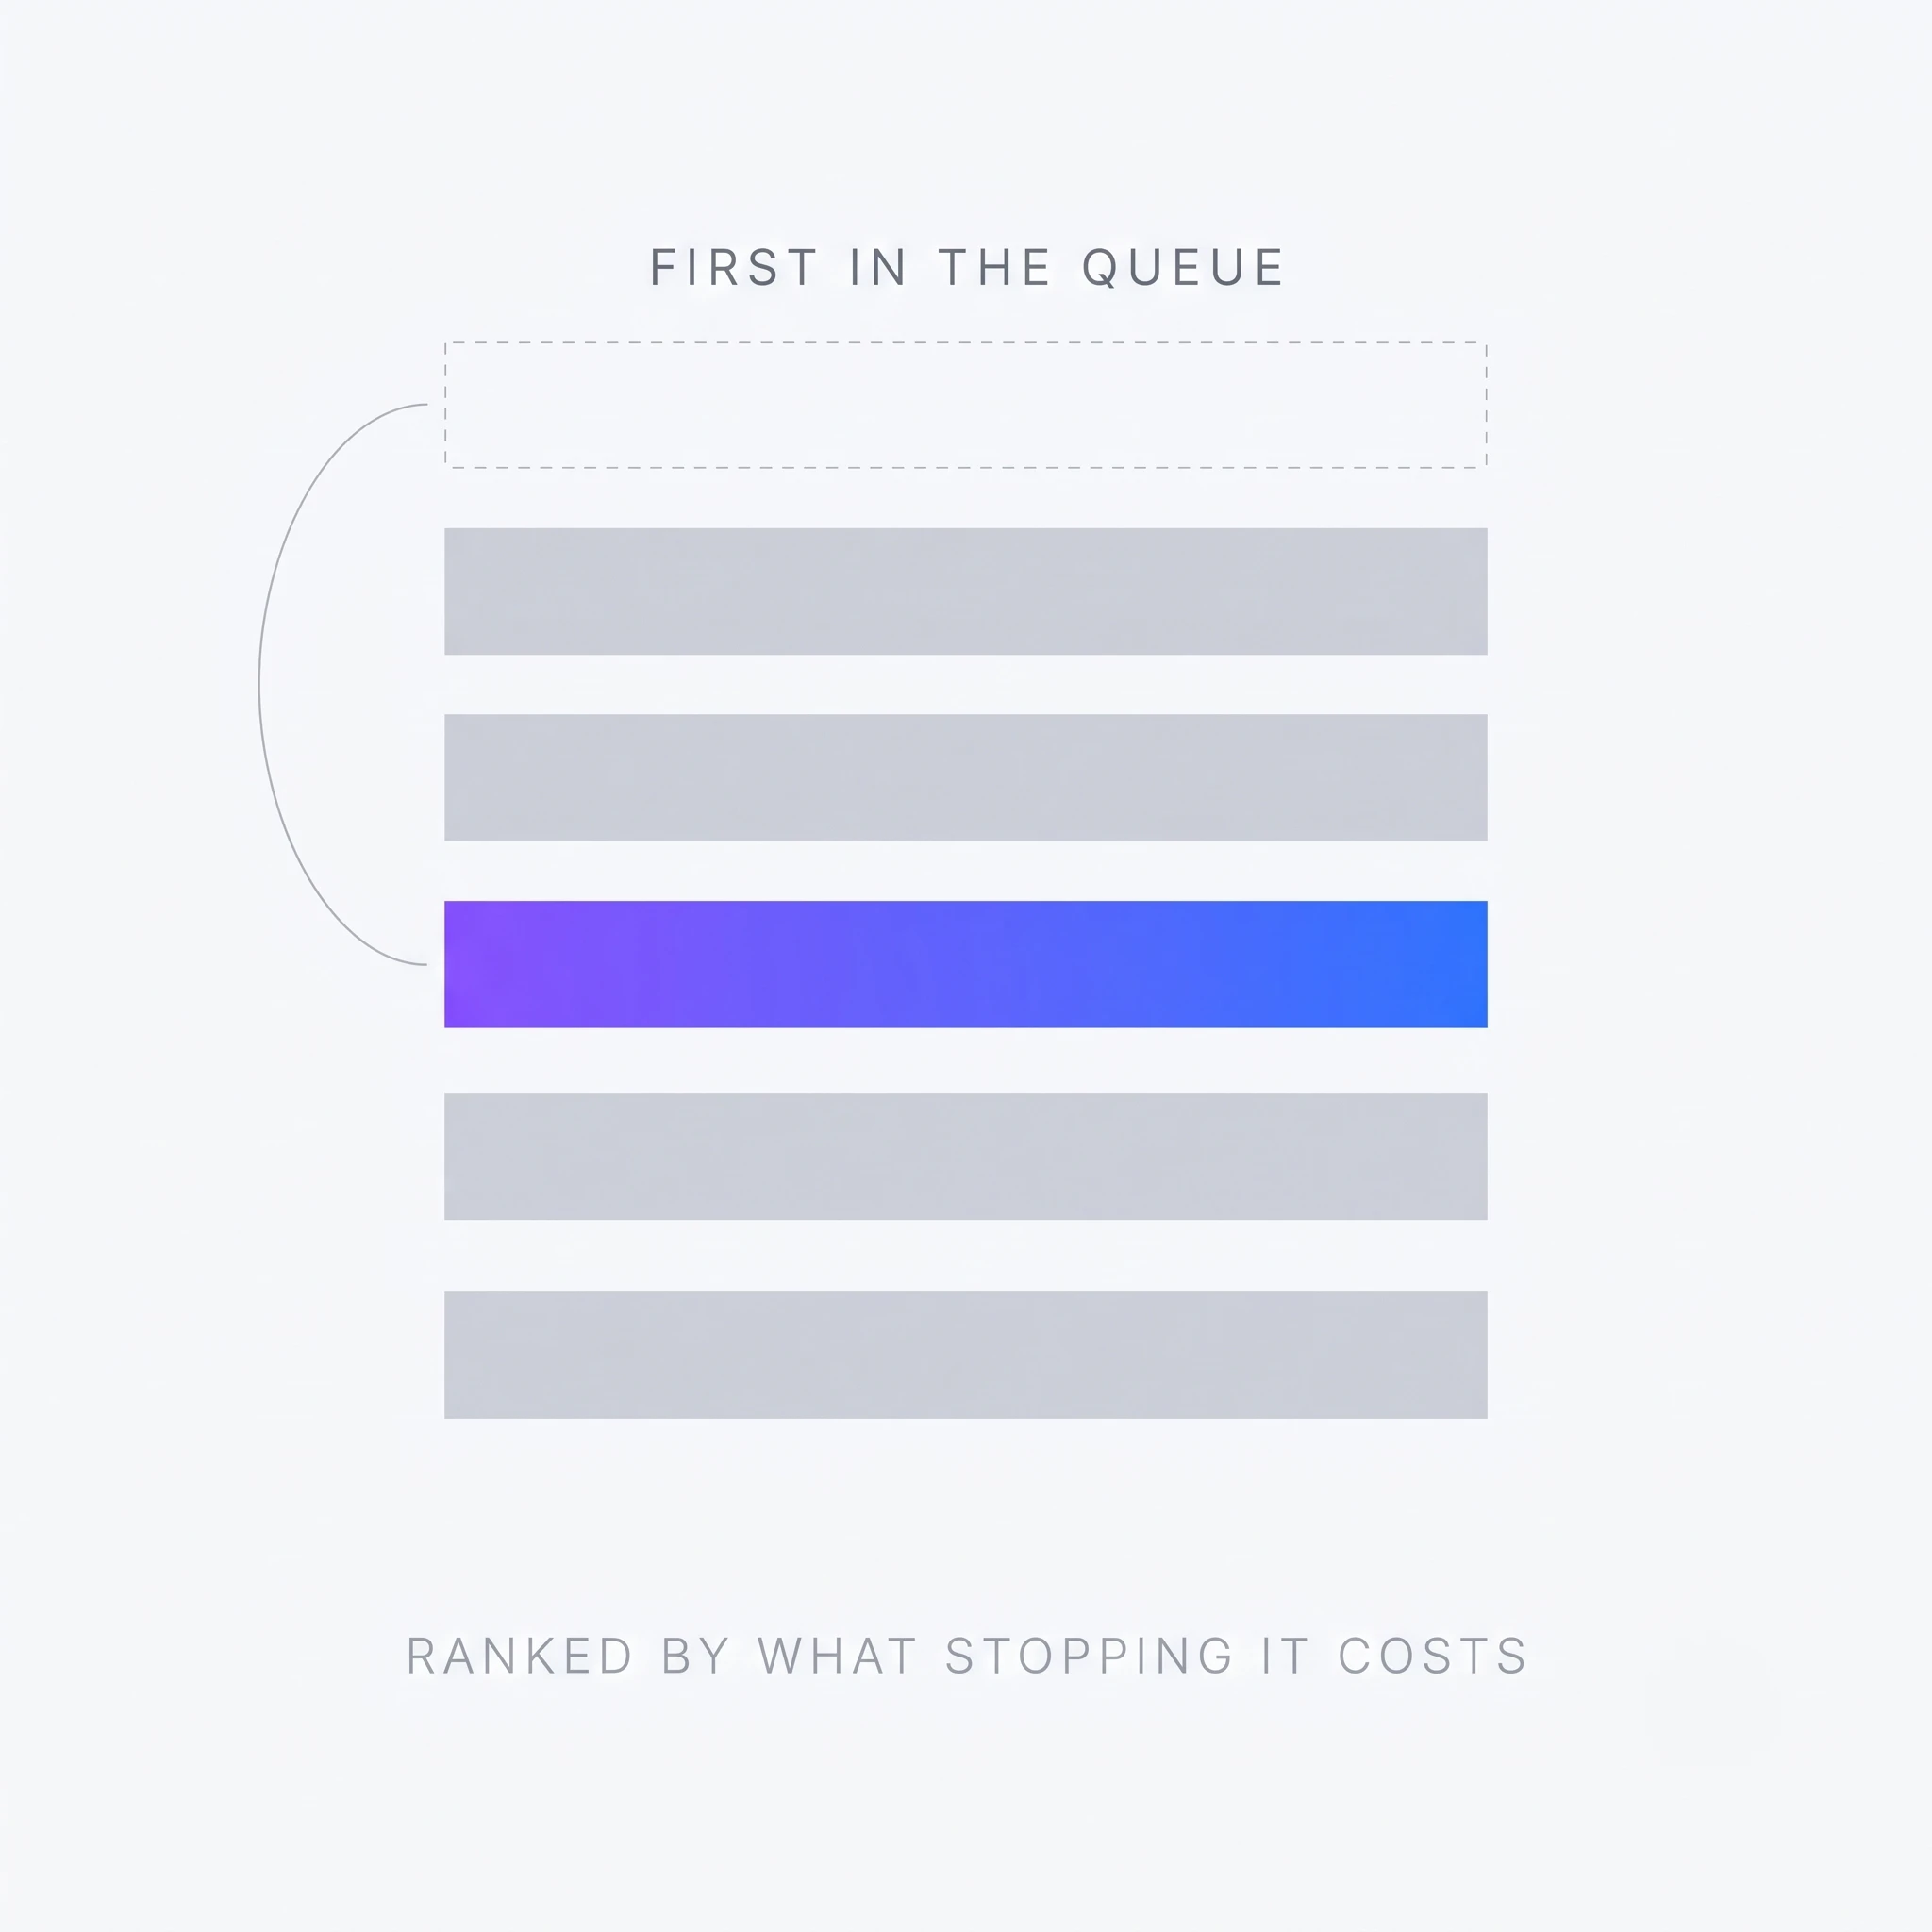
    Alarm severity tells you how sick an asset is. It does not tell you what stopping that asset costs. A moderate fault on a single-line kiln outranks a severe fault on a redundant pump every time, and most maintenance backlogs are not sorted that way.


    Prescriptive AI prioritizes maintenance tasks by urgency and production impact
    Ranked by what stopping it costs

    Prescriptive AI ranks every open prescription by urgency and production impact, so the daily queue reflects tonnes at risk rather than decibels. Decision lag collapses because the argument about sequencing has already been settled by the data.

    4. It ends at a work order, so the fix actually happens

    This is where most deployments quietly stall. The insight lives in one system and the maintenance plan lives in another, with the translation depending on someone having a free afternoon.


    A prescription reaches the operator on dashboard, email and mobile, carries a defined corrective action and a deadline, and is closed with a digital signoff. What the plant head opens in the morning is a prioritized daily queue instead of a risk chart. SPCC replaced reactive firefighting with exactly that queue and reported 9X ROI in under six months.

    “Our team is no longer running from one breakdown to the next. We now start our day with a prioritized list from the system, telling us which machine needs attention. The system is amazing.”

    Mr. Alaa Farrag, Maintenance Manager, SPCC

    Anatomy of a prescription

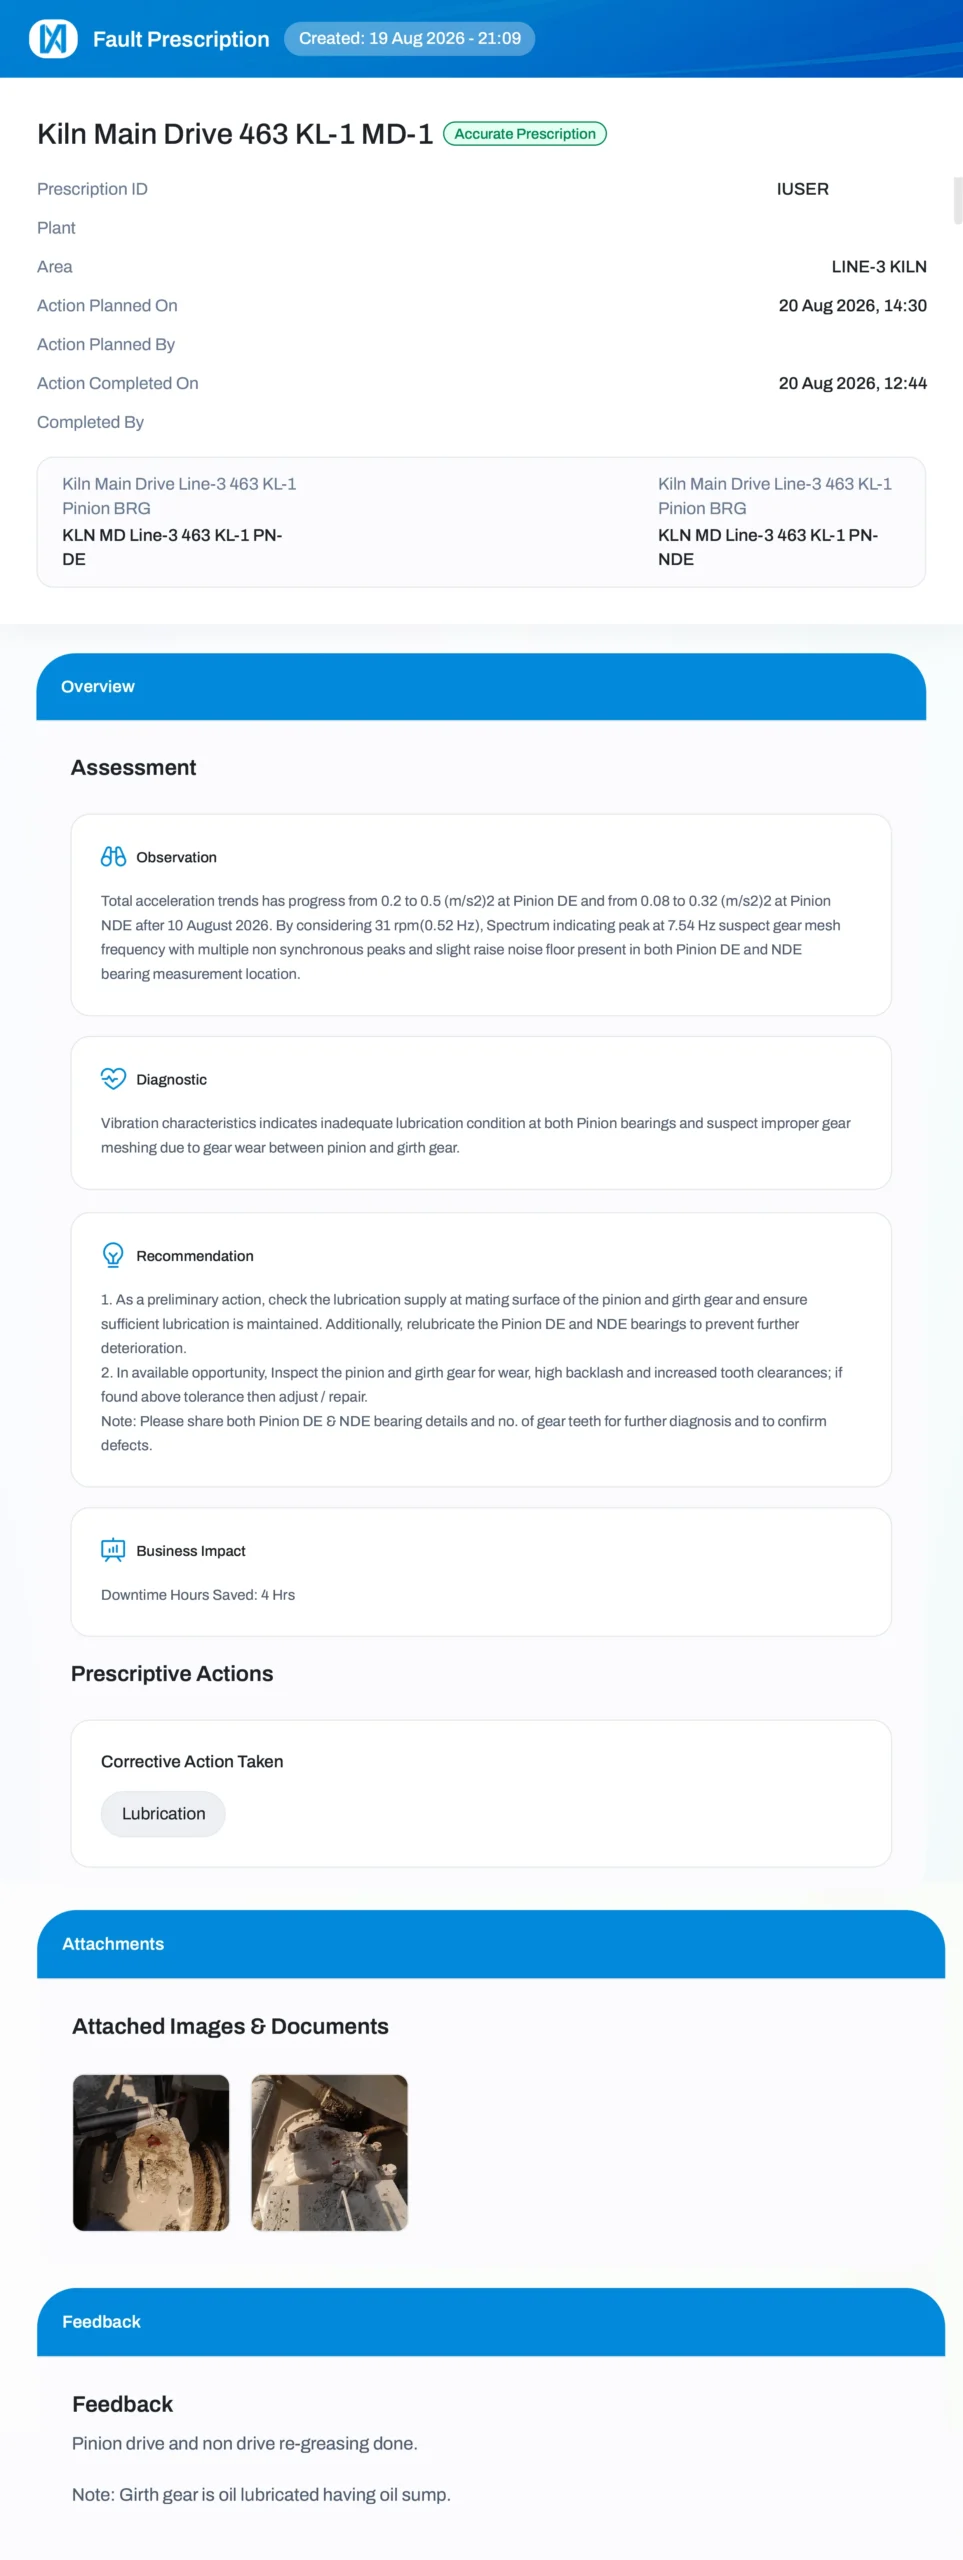
    Everything described above arrives as one document. Below is a live prescription issued by PlantOS™ on a cement kiln main drive, closed by the plant’s own maintenance engineer.


    Click any number (1–8) on the document to view details


    1


    2


    3


    4


    5


    6


    7


    8


    PlantOS Fault Prescription for a cement kiln main drive showing observation

    1. 1
      The header and the verdict

      The document is titled a Fault Prescription, not an alert, and it carries a status chip reading
      Accurate Prescription. That chip is the plant’s judgement on whether the diagnosis held, not the
      model’s own. This is what accuracy measured by customer validation means in practice.

    2. 2
      The asset, down to the bearing

      Not “kiln” but Kiln Main Drive Line-3 463 KL-1, monitored at the pinion bearing drive end and
      non-drive end. A generic model would report an anomaly on a kiln. An equipment-specific model
      knows the pinion and girth gear set exists and knows how it fails.

    3. 3
      The clock

      Created 19 August at 21:09, planned for 20 August at 14:30, completed at 12:44 the same day. The
      decision lag and the execution lag are visible as timestamps, and the job closed ahead of its
      own window rather than waiting for the next shutdown. (Where
      the downtime hours actually go)

    4. 4
      Observation

      Total acceleration climbing from 0.2 to 0.5 (m/s²)² at the drive end and 0.08 to 0.32 at the
      non-drive end after 10 August, with a spectral peak at 7.54 Hz read against a 31 rpm running
      speed. This is the part a predictive layer delivers on its own, and it is where most systems
      stop.

    5. 5
      Diagnostic

      The step that usually waits for an analyst. Inadequate lubrication at both pinion bearings, with
      improper gear meshing suspected from wear between pinion and girth gear. The trend has become a
      named fault with a cause attached.

    6. 6
      Recommendation

      Two actions in deliberate sequence. Restore lubrication at the pinion and girth gear mating
      surface and relubricate both bearings immediately, then inspect the gear set for wear, high
      backlash and tooth clearance at the next available opportunity. Immediate protection is
      separated from planned intervention, so the production plan is defended without calling a
      stoppage.

    7. 7
      Business impact

      The prescription states its own value on the document at four hours of downtime saved, in the
      same view as the technical evidence. The number is not reconstructed afterwards for a quarterly
      review.

    8. 8
      Closure and feedback

      Corrective Action Taken records lubrication as the work performed, with field photographs
      attached from the floor. Below that, the engineer writes back: pinion drive and non-drive end
      re-greasing done, with a note that the girth gear is oil lubricated and has an oil sump. That
      last line is plant knowledge the model did not have, entering the system through the person
      holding the grease gun.

    One prescription, one asset, one shift. Repeat that across 1,000 plants and it becomes 167,837 hours of unplanned downtime saved.

    5. It records the outcome, so next quarter is faster than this one

    When an operator validates whether the prescribed fix was correct, that signoff becomes a labelled outcome, and labelled outcomes train sharper models. PlantOS™ formalizes this as the 99% Trust Loop: accuracy builds trust, trust drives action, action produces validated feedback, and feedback improves the next prescription. A prescriptive deployment is therefore worth more in year three than in year one, because the fault library is now built from your own assets.

    What the compression is worth

    PlantOS™ is live across 1,000 plants in 28 countries, running at 99.97 % prediction accuracy with up to 99 % of prescriptions acted upon. Customers see up to 10 % lower maintenance cost and up to 2.5 % higher throughput, with every figure signed off by their own reliability and operations teams. Hindustan Zinc Ltd of Vedanta Group reported over $700K in savings as published by Vedanta Spark, while JSW Steel runs the platform across 139 plants and Coromandel International across 27.


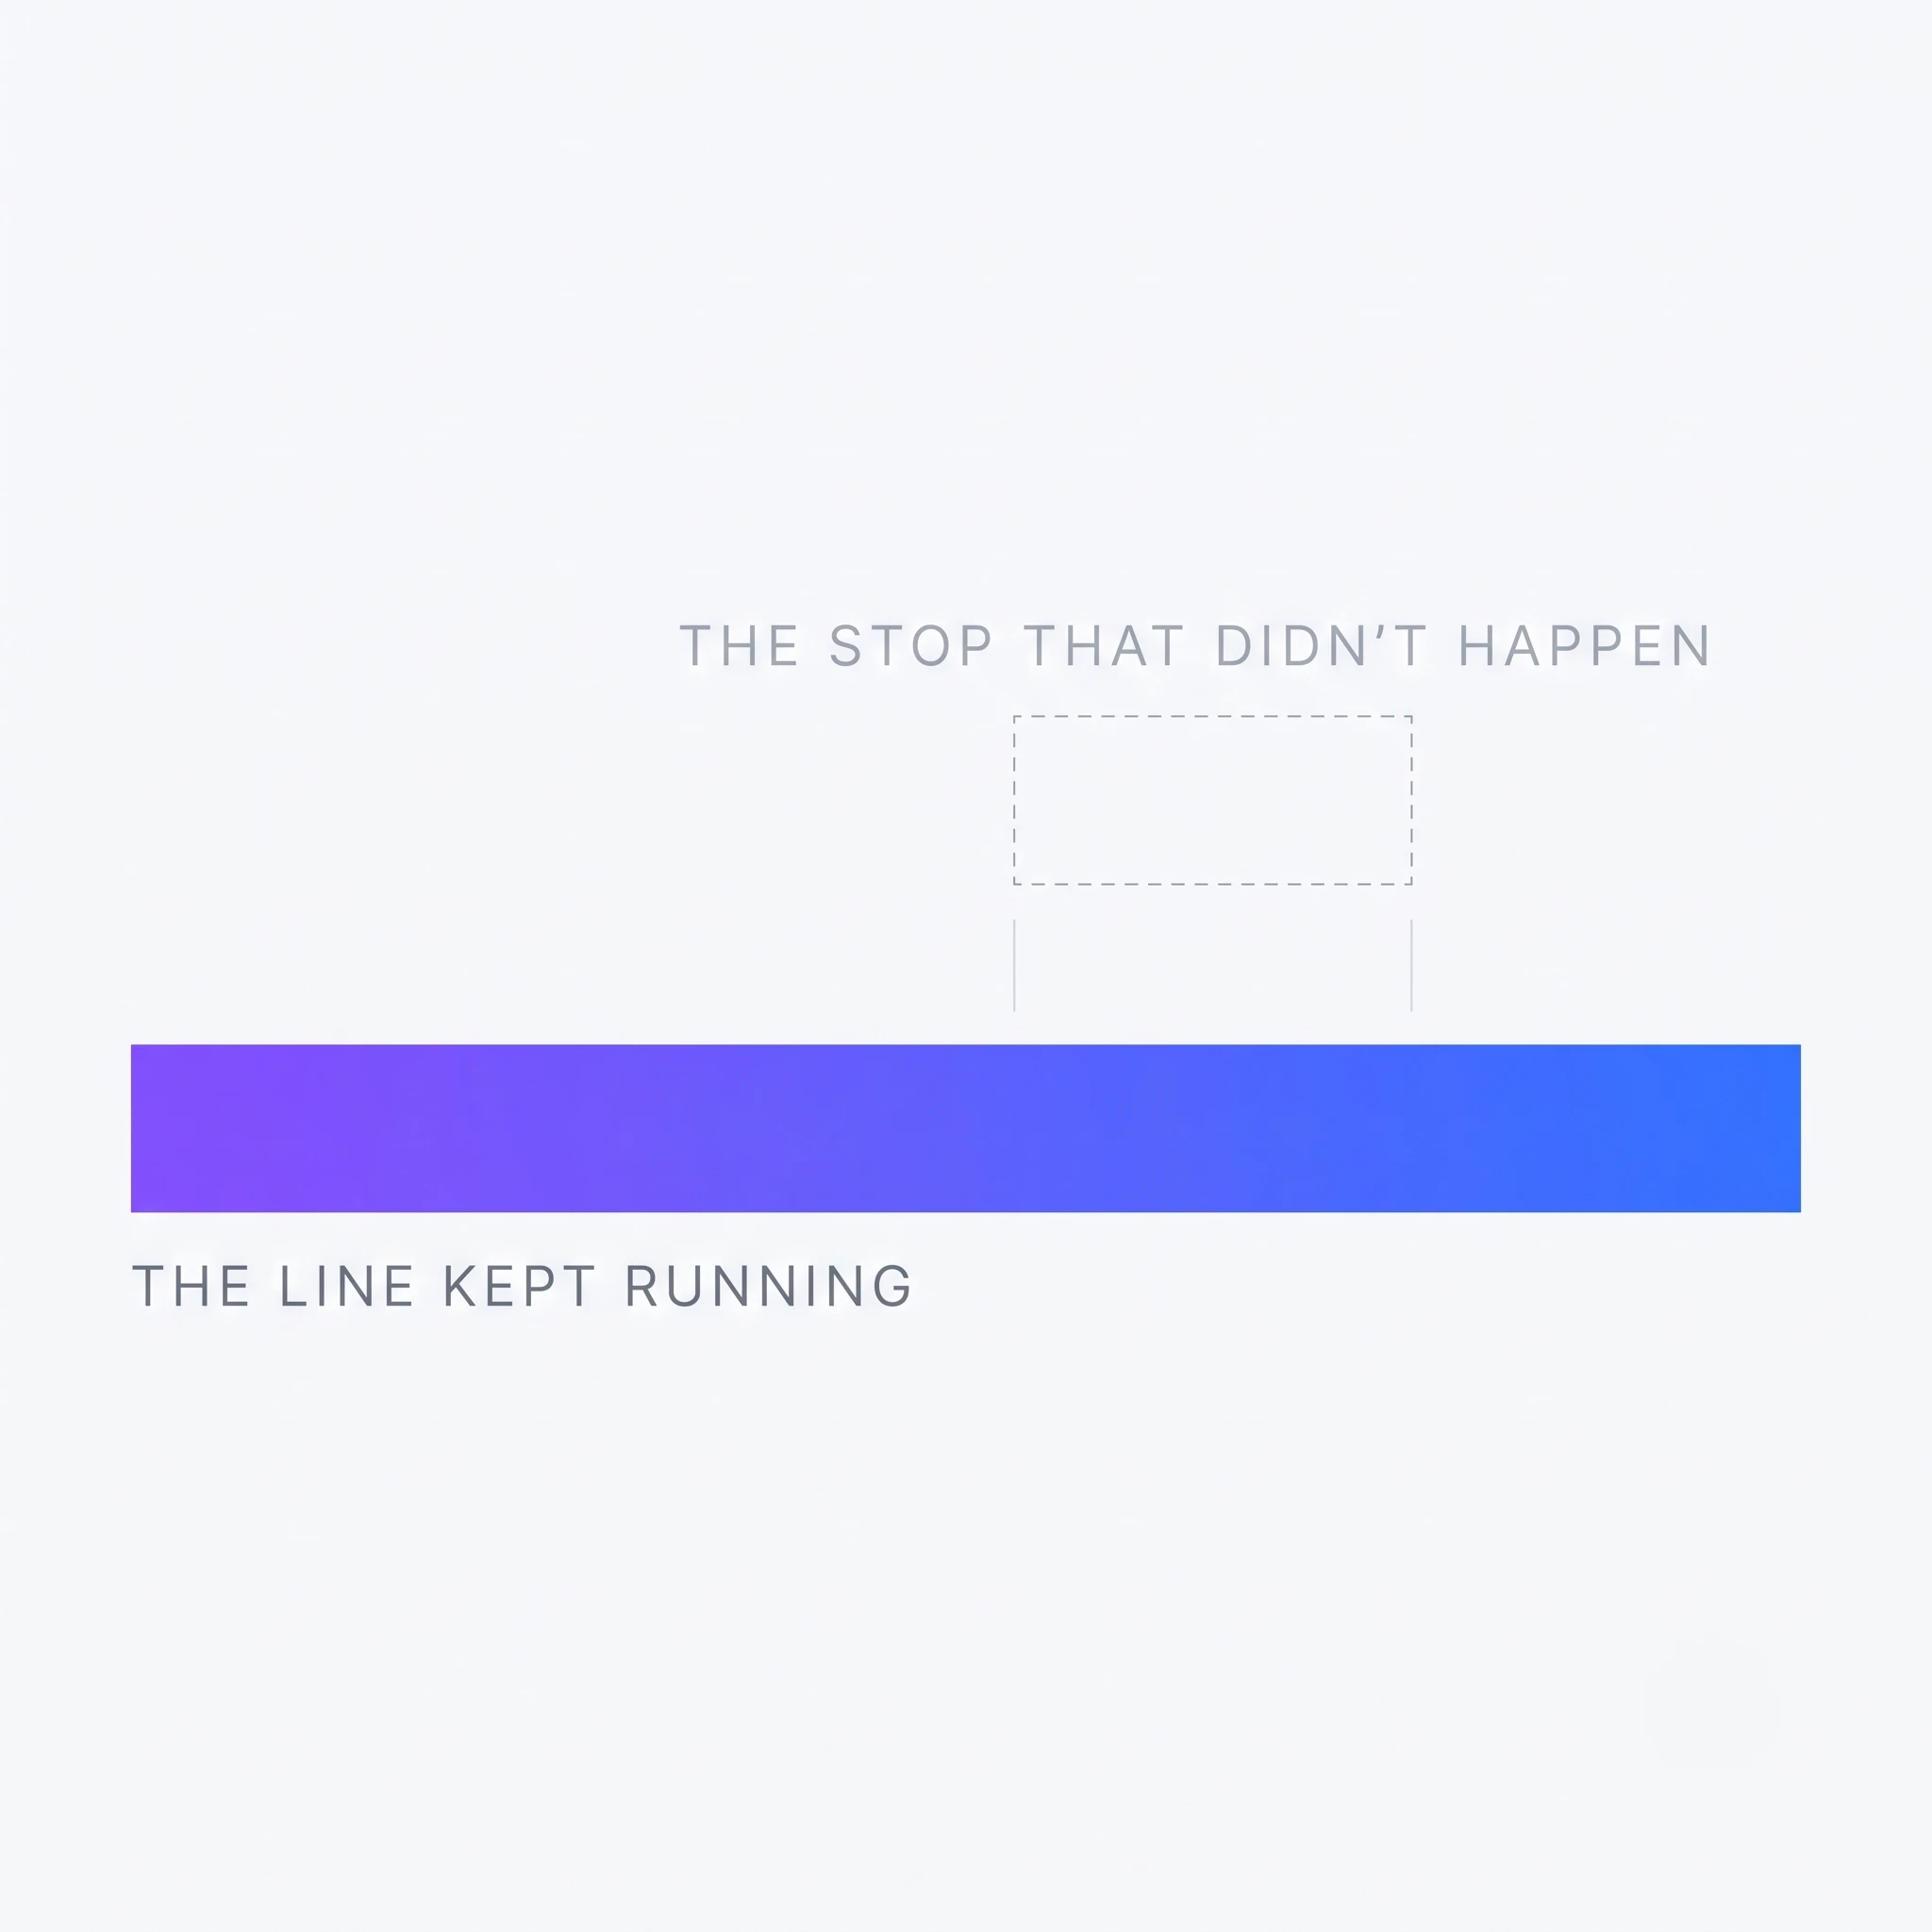
    PlantOS Prescriptive AI preventing unplanned downtime and keeping the production line running
    The stop that didn’t happen

    Auditing your own downtime in one shift

    Pull the last four unplanned stops on your most critical line and answer four questions.

    1

    Was the degradation visible in the data before the stop?

    2

    How many days passed between the first signal and a confirmed diagnosis?

    3

    Was the job ranked against production impact or against alarm severity?

    4

    Did the recommendation become a work order, and was the outcome recorded anywhere the model could learn from?

    If detection was fine and the answers to the last three are uncomfortable, the plant does not have a sensing gap. It has an instruction gap.

    Start with your most critical line. Try PlantOS™

    Frequently Asked Questions


    How does Prescriptive AI reduce unplanned downtime?

    It reduces the time between a fault developing and a corrective job being completed. Prescriptive AI diagnoses the fault mode automatically, ranks it by production impact, issues a corrective action with a deadline to the operator, and records the signoff. Detection is only the first of four intervals that create downtime, and prescriptive maintenance solutions compress the remaining three.


    What does a PlantOS™ prescription contain?

    Each prescription carries the observed trend and spectral evidence, a diagnostic naming the fault and its cause, a sequenced corrective action, a planned date, the operator who closed it, the corrective action actually performed, field photographs, written feedback from the floor, and the downtime hours saved. The example above shows a kiln main drive lubrication and gear wear fault closed inside sixteen hours for four hours of downtime saved.


    How much downtime can a prescriptive maintenance programme realistically save?

    Savings scale with production value per hour rather than asset count. Across the PlantOS™ install base, 167,837 hours of unplanned downtime have been saved, with customers reporting up to 10 % lower maintenance cost and up to 2.5 % higher throughput.


    How quickly does it start working after installation?

    The first prescription is typically issued within two weeks of installation, with a structured 90-day path to measurable production outcomes. Self-powered wireless sensors install without gateways or plant cabling, so commissioning does not require a shutdown.


    Does it replace our existing predictive maintenance system?

    No. Prediction remains the detection engine, and Prescriptive AI adds diagnosis, prioritization, instruction and validation above it. Plants with existing sensor coverage and asset baselines usually reach value faster.


    Do we need to change our CMMS or historian?

    No. PlantOS™ operates alongside existing PLC, historian, SCADA and CMMS environments rather than displacing them, so the prescription lands inside the maintenance workflow your team already uses.


    What should we measure to know it is working?

    Track prescription action rate, which is the percentage of issued prescriptions executed on the floor, alongside mean time from signal to closure. A platform with high accuracy and a low action rate has an adoption problem rather than a modelling problem.

  • 5 Reliability Blind Spots Hidden in Industrial Assets

    5 Reliability Blind Spots Hidden in Industrial Assets

    5 Reliability Blind Spots Hidden in Industrial Assets

    Read Time: 7–9 minutes | Author – Kalyan Meduri

    5 Reliability Blind Spots Hidden in Industrial Assets, Infinite Uptime PlantOS.


    Key Takeaways

    In short: Most reliability programs fail on coverage and closure rather than on effort.
    The assets that break the production plan are usually the ones sitting outside the monitoring map,
    outside the mechanical fault model, or outside the record of what actually got fixed.

    • Balance of plant equipment is the largest uncovered risk.
      Critical machine monitoring absorbs the budget while the unwatched majority of rotating assets
      keeps triggering line stoppages.
    • Process-induced faults hide behind clean mechanical readings.
      A bearing that looks healthy can be failing because of thermal load, build-up, or drift upstream of it.
    • Sensor reliability collapses at the edges.
      Ultra-slow-speed, high-temperature, and hazardous-area assets are where standard hardware
      under-reports without anyone noticing.
    • A fragmented sensor estate blocks enterprise comparison.
      Without enterprise-wide sensor standardization, no two plants produce comparable asset health data.
    • Unclosed recommendations are invisible losses.
      If nobody records whether the fix was made and whether it worked, the program cannot prove value or improve.

    Ask any reliability engineer at a large plant whether they have a condition monitoring program, and the answer is yes. Ask whether last quarter’s biggest unplanned outage was predicted by it, and the answer is usually more complicated.


    The failure is rarely one of diligence. It is one of visibility. Industrial condition monitoring tends to be designed around the assets that leadership already worries about, using models that read the machine in isolation, on hardware chosen plant by plant. Everything outside that frame becomes a blind spot, and blind spots are where downtime originates.


    Here are the five that show up most often across large manufacturing enterprises.


    The Five Blind Spots

    Where reliability programmes lose ground


    01

    Balance of plant

    The unwatched long tail of pumps, fans, blowers, gearboxes and conveyors sitting
    directly in the production path.


    02

    Process-induced faults

    Ring formation, coating build-up, thermal overstress and tension drift degrade the
    machine from the outside in.


    03

    Harsh-duty under-reporting

    Ultra-slow-speed, high-temperature and hazardous-area assets where standard
    hardware quietly under-reports.


    04

    A fragmented sensor estate

    Different vendors, sampling rates and thresholds per site, so no two plants produce
    comparable asset health data.


    05

    No record of closure

    Recommendations that are never formally closed with an outcome, so the programme
    cannot prove value or improve.


    Coverage

    Context

    Correct hardware

    Common data layer

    Closure

    A blind spot at any one of these five stages puts downtime hours back on the
    production plan.

    The five blind spots, and the sequence that closes each of them: coverage → context
    → correctly rated hardware → a common data layer → closure.


    1. The balance of plant equipment nobody watches

    Most predictive maintenance programs start with the top twenty assets. That is the right place to start and the wrong place to stop.


    Below the critical tier sits a long tail of pumps, fans, blowers, gearboxes, and conveyors that carry no individual reputation for risk but sit directly in the production path. A single cooling water pump can stop a line as effectively as a kiln can. Because these assets are cheap to replace, they are treated as consumables, and because they are treated as consumables, they are never instrumented.


    The cost hides in the failure log rather than in the maintenance budget. When teams audit unplanned stoppage hours by asset class, a substantial share traces back to equipment that was never on the monitoring map. Closing this blind spot has become practical only recently, with self-powered wireless sensors that install in minutes without gateways and bring full plant coverage within reach of a normal reliability budget.

    2. Faults that begin in the process, not in the machine

    This is the blind spot built into the physics of most predictive maintenance programs. Vibration analysis is exceptionally good at reading what happens inside a machine: bearing wear, unbalance, misalignment, looseness, lubrication degradation, gear-mesh anomalies.


    It is much weaker at reading what the process is doing to that machine. Kiln ring formation, cyclone coating build-up, thermal overstress, ladle heat profile drift, hot-strip thermal fatigue, and web tension drift all degrade equipment from the outside in. By the time these produce a recognizable mechanical signature, the damage is advanced and the intervention window has narrowed to a shutdown.


    Industrial AI closes this only when it contextualizes both data streams together. Infinite Uptime’s PlantOS™ reads mechanical fault signatures alongside process data from the PLC and historian, which is what allows a prescription to name the operating condition driving the fault rather than the symptom it produced. Explaining the cause is what makes the recommendation actionable for a maintenance manager who has to justify taking equipment offline.

    3. Assets where standard sensors quietly under-report

    Sensor reliability is usually assumed rather than verified. The assumption breaks in exactly the places that matter most.


    Ultra-slow-speed equipment running at around two revolutions per minute produces energy at frequencies that general-purpose accelerometers struggle to resolve. High surface temperatures near 150 degrees Celsius degrade adhesives, cabling, and sensor electronics over time. Dust, wash-down, vibration shock, and hazardous-area classification each rule out categories of standard hardware.


    Where Standard Sensors Quietly Under-Report

    Specify against the harshest asset on site, not the easiest


    ~2 rpm

    Ultra-slow speed

    Energy at frequencies general-purpose accelerometers struggle to resolve.


    150 °C

    High surface temperature

    Degrades adhesives, cabling and sensor electronics over time.


    IP + Ex

    Dust, wash-down, hazardous area

    Ingress protection and area certification rule out standard hardware.


    Worse than no data, because it looks like good data.

    The dashboard shows the asset within limits, the engineer reasonably trusts it, and the
    fault develops unobserved.

    The three conditions where general-purpose hardware under-reports without anyone noticing.


    What follows is worse than no data, because it looks like good data. The dashboard shows an asset within limits, the reliability engineer reasonably trusts it, and the fault develops unobserved. Any serious critical machine monitoring specification should state the speed range, surface temperature, ingress protection, and area certification the hardware is rated for, and should be tested against the harshest asset on site rather than the easiest.

    4. A sensor estate that cannot be compared across plants

    At single-site level this blind spot is invisible. It appears the moment a corporate reliability function tries to compare performance across the group.


    Plants procure independently. One site runs one vendor, another runs a second, a third still uses route-based data collection on a handheld. Sampling rates differ, fault taxonomies differ, and severity thresholds are set locally. The result is that a red alert at Plant A and a red alert at Plant B mean different things, so the group has asset health data without an asset health baseline.


    Enterprise-wide sensor standardization solves an analytics problem more than a procurement one. A common data layer lets you rank assets by risk across the entire network, move a proven prescription from one site to another, and hold plants to a comparable reliability KPI. Multi-plant deployment on a single platform is what makes that possible, and it is how JSW Steel operates PlantOS™ across 139 plants in India and the USA, and how Coromandel International runs it across 27.

    5. Recommendations with no record of closure

    The final blind spot is not on the plant floor. It is in the workflow.


    Alerts are generated, someone reviews them, some are acted on, and very few are formally closed with an outcome. When the quarterly review arrives, nobody can state what percentage of recommendations were executed or how many prevented a failure. The program is judged on alert volume, which is the one number that grows whether or not reliability improves.


    Prescriptive maintenance solutions are built to remove this gap. The prescription reaches the operator with a defined action and deadline, and it closes with a digital signoff confirming whether the fix worked. That signoff does two jobs at once. It gives the reliability leader a defensible action rate, and it gives the models a labelled outcome to learn from. Across the PlantOS™ install base, up to 99 percent of prescriptions are acted upon at 99.97 percent user-validated accuracy.

    Run the audit in one shift

    Five questions that expose most of the above without a consultant

    1

    What percentage of rotating assets in the production path have no sensor on them today?

    2

    When did a mechanical alert last identify a process-induced cause correctly?

    3

    Which asset on site has the harshest duty conditions, and is the hardware on it rated for them?

    4

    Do two plants in the group define a severity threshold the same way?

    5

    What percentage of last quarter’s recommendations were closed with a recorded outcome?

    If detection was fine and the answers to the last three are uncomfortable, the plant does not have a sensing gap. It has a coverage and closure gap.

    Start with your most critical line. Try PlantOS™.

    Seeing the whole plant

    Reliability maturity is often described as a progression from reactive to preventive to predictive. A more useful test is simpler: how much of the plant can you actually see, and how much of what you see gets acted on.


    PlantOS™ is live across 1,000 plants in 28 countries, with 167,837 hours of unplanned downtime saved and every figure validated by the customer teams that logged it. For manufacturing enterprises, the fastest reliability gain rarely comes from a better model on the assets already covered. It comes from the assets, fault types, and workflow steps that nobody was looking at.

    Start with your most critical line. Try PlantOS™.

    Frequently Asked Questions


    What is a reliability blind spot?

    An asset, failure mode, or workflow step that a condition monitoring program does not observe, so risk accumulates without appearing in any report.


    Does adding more sensors remove blind spots?

    Only partly. Coverage addresses the first blind spot. The remaining four require process context, correctly rated hardware, a standardized data layer, and closed-loop validation.


    How do reliability teams monitor slow-speed or high-temperature assets?

    With hardware specified for those conditions and models trained on that asset class, rather than general-purpose accelerometers with generic anomaly detection applied on top.


    What does enterprise-wide sensor standardization actually solve?

    It gives a corporate reliability function a common data layer, so asset health can be compared across plants, a proven prescription can move from one site to another, and every plant is held to the same reliability KPI.


    How is a closed recommendation different from a completed alert?

    A closed recommendation carries a digital signoff confirming whether the fix worked, not just a record that someone reviewed the alert. That signoff is what gives a reliability leader a defensible action rate and gives the model a labelled outcome to learn from.


    What should we measure to know our reliability programme is working?

    Track sensor coverage of the full rotating-asset population, not just the top-tier assets, alongside the percentage of recommendations closed with a recorded outcome. A programme with wide coverage and a low closure rate has a workflow problem rather than a monitoring problem.

  • 7 Ways Prescriptive Maintenance Is Different from Standard Predictive Maintenance

    7 Ways Prescriptive Maintenance Is Different from Standard Predictive Maintenance

    7 Ways Prescriptive Maintenance Is Different from Standard Predictive Maintenance

    Read Time: 7–9 minutes | Author – Rahul Narvekar Prediction is not equal to Outcomes


    Key Takeaways

    In short: Predictive maintenance tells you an asset is likely to fail.
    Prescriptive Maintenance tells your operators which fault to fix, why, and by when,
    then captures whether the fix worked.

    • From score to instruction.
      Predictive outputs a probability. Prescriptive outputs a named fault,
      a corrective action, and a deadline, ranked by production impact.
    • From equipment data to equipment plus process data.
      Mechanical signatures alone miss the operating conditions that accelerate failure.
    • From accuracy to action rate.
      Alerts prove nothing until they are executed. Across the PlantOS™ install base,
      up to 99 % of prescriptions are acted upon.
    • From dashboard to work order.
      The prescription reaches the operator on a dashboard, email, and mobile
      and closes with a digital signoff, not a risk chart.
    • From licence to outcome.
      Infinite Uptime’s PlantOS™ is delivered as Production Outcomes as a Service,
      committed against less downtime, more throughput, and lower cost per ton.

    Most large plants already have predictive maintenance. Sensors are mounted,
    models are trained, and a dashboard somewhere lists assets by risk score.
    Yet unplanned downtime persists, work orders still get raised after the noise starts,
    and the reliability review still opens with a breakdown post-mortem.

    The gap is not detection. The gap is instruction.

    Prescriptive maintenance solutions close that gap by moving from a forecast to a directive:
    which fault, why it is developing, what to do, and by when. For maintenance managers and
    reliability leaders evaluating prescriptive AI software against their existing stack, here
    are the seven differences that actually change plant outcomes.


    1. 01

      Predictive forecasts failure.
      Prescriptive assigns the fix.

      A predictive model outputs probability. It tells you an asset is trending toward failure
      within a window, and it hands the diagnosis back to your team to complete.

      Prescriptive AI completes the diagnosis itself and issues an instruction. The output is a
      specific fault mode on a specific asset, ranked by urgency and production impact, with
      the corrective action attached. Your reliability engineer stops interpreting a waveform
      and starts scheduling a job. That single shift is what separates prescriptive
      maintenance platforms
      from an alerting layer.

      Predictive forecasts failure, Prescriptive assigns the fix


    2. 02

      Predictive reads the equipment.
      Prescriptive reads the equipment and the process.

      Traditional predictive maintenance is built on mechanical fault signatures: bearing wear,
      unbalance, misalignment, looseness, lubrication degradation. Those are real, and they
      matter.

      But in heavy manufacturing, a large share of mechanical failure is induced from outside
      the machine. Kiln ring formation, thermal overstress, cyclone coating buildup, ladle
      heat profile drift, and web tension drift all accelerate degradation without producing a
      clean mechanical signature early on. Prescriptive AI contextualizes equipment data
      alongside process data from the PLC and historian, so the fault is explained by its
      cause rather than described by its symptom.

      Predictive reads the equipment, Prescriptive reads the equipment and the process


    3. 03

      Predictive is generic.
      Prescriptive is equipment specific.

      A general anomaly detection model treats a kiln, a Banbury mixer, and an EOT crane as
      variations of rotating equipment. It finds deviation. It rarely finds the failure mode.

      Vertical AI is tuned to the failure taxonomy of the asset itself. Infinite Uptime’s
      PlantOS™ delivers this through AI Shields, equipment-specific models built on Dynamic
      FMEA for kilns, mills, cranes, furnaces, mixers, extruders, and dryers. The difference
      shows up in coverage and explainability. A generic model flags an anomaly on a mill. An
      equipment-specific model names gear-mesh backlash and links it to the load condition
      that caused it.

      Predictive is generic, Prescriptive is equipment specific


    4. 04

      Predictive is measured on accuracy.
      Prescriptive is measured on action.

      Ask most industrial maintenance software vendors for their headline metric and you will
      get accuracy or alert volume. Neither tells you whether anything got fixed.

      The metric that governs a prescriptive program is the action rate: what percentage of
      prescriptions issued are actually executed on the floor. Across the PlantOS™ install
      base, up to 99 % of prescriptions are acted upon, against 99.97 % prediction accuracy.
      Accuracy earns trust, trust drives action, and action is where downtime hours are
      recovered. A platform with high accuracy and low action rate has an adoption problem,
      not a modelling problem.

      Predictive is measured on accuracy, Prescriptive is measured on action


    5. 05

      Predictive ends at the dashboard.
      Prescriptive ends at the work order.

      This is where most predictive deployments quietly stall. The insight lives in one system,
      the maintenance plan lives in another, and the translation between them depends on one
      experienced engineer having time to do it.

      Prescriptive maintenance solutions are designed to terminate in the maintenance workflow,
      not in a visualization. The prescription reaches the operator on mobile, carries a
      defined action and deadline, and is closed with a digital signoff. What the plant head
      sees is not a risk chart but a prioritized daily queue. SPCC replaced reactive
      firefighting with exactly that queue and reported 9X ROI in under six months.

      Predictive ends at the dashboard, Prescriptive ends at the work order

      “Our team is no longer running from one breakdown to the next. We now start our day with a
      prioritized list from the system, telling us which machine needs attention. The system is
      amazing.”

      – Mr. Alaa Farrag, Maintenance Manager, SPCC


    6. 06

      Predictive learns from data.
      Prescriptive learns from data and operators.

      A predictive model retrains on more of the same signal. Its ceiling is set by the labels
      it was given at the start.

      Prescriptive AI closes the loop with the people who work the machine. When an operator
      validates whether the prescribed fix was correct, that signoff becomes a labelled
      outcome, and labelled outcomes train sharper models. PlantOS™ formalizes this as the 99%
      Trust Loop: accuracy builds trust, trust drives action, action produces validated
      feedback, feedback improves the next prescription. Every cycle compounds, which is why a
      prescriptive deployment gets more valuable in year three than it was in year one.

      Predictive learns from data, Prescriptive learns from data and operators


    7. 07

      Predictive is delivered as software.
      Prescriptive is delivered as an outcome.

      The commercial model is the difference reliability leaders underestimate. Industrial
      maintenance software is typically licensed per asset or per seat, and the value case
      rests on the buyer to prove after the fact.

      Infinite Uptime’s PlantOS™ is delivered as Production Outcomes as a Service, with the
      commitment expressed in plant KPIs rather than platform features: less unplanned
      downtime, more throughput, lower cost per ton. Customers see up to 10 % lower
      maintenance cost, up to 2.5 % higher throughput, and figures validated by their own
      reliability and operations teams.

      Predictive is delivered as software, Prescriptive is delivered as an outcome


    Predictive maintenance comparison at a glance

    How to evaluate prescriptive maintenance platforms

    Five questions separate a genuine prescriptive capability from a rebranded predictive one:

    1

    Does the output name a fault mode and a corrective action, or only a risk score?

    2

    Does the model ingest process data, or equipment data alone?

    3

    What percentage of prescriptions are acted upon at reference sites?

    4

    Who validates the outcome, and is that validation fed back into the model?

    5

    Is the contract written against plant KPIs or platform access?

    If a vendor cannot answer question three with a number from live plants, the deployment risk sits with you.

    The shift worth making

    Prediction was a real advance over calendar-based maintenance, and it earned its place. The limitation is that a forecast alone does not schedule a job, free up a shift, or protect a production plan.


    PlantOS™ is now live across 1,000 plants in 28 countries, with 167,837 hours of unplanned downtime saved and every figure signed off by the customer teams that logged it. For manufacturing enterprises pursuing maintenance optimization at scale, the practical question is no longer whether the plant can see failure coming. It is whether the plant acts in time.

    Start with your most critical line. Try PlantOS™

    Frequently Asked Questions


    What is prescriptive maintenance?

    Prescriptive maintenance is an industrial AI approach that identifies a developing fault, explains its cause, and issues a specific corrective action with a deadline and a priority. It goes beyond detecting that an asset may fail by telling the maintenance team which fix to perform, on which asset, and before which date, then recording whether that fix worked.


    How is prescriptive maintenance different from predictive maintenance?

    Predictive maintenance outputs a probability of failure. Prescriptive maintenance outputs an instruction. The practical differences are scope of data, since prescriptive AI reads process signatures alongside mechanical ones, and endpoint, since a prescriptive workflow closes at a work order with operator signoff rather than at a dashboard. The governing metric also shifts from alert accuracy to prescription action rate.


    Is prescriptive maintenance a replacement for predictive maintenance?

    No, it is the layer above it. Prediction remains the detection engine, and prescriptive AI software adds diagnosis, instruction, prioritization, and validation on top so that detection converts into completed maintenance work. Plants with a mature predictive program usually reach value faster, because sensor coverage and asset baselines already exist.


    Does prescriptive AI require replacing existing systems?

    No. Infinite Uptime’s PlantOS™ operates alongside existing PLC, historian, SCADA, and CMMS environments rather than displacing them, and self-powered wireless sensors install without gateways or plant cabling. The first prescription is typically issued within two weeks of installation, with a structured 90-day path to measurable production outcomes.


    How quickly do prescriptive maintenance solutions deliver ROI?

    Most large plants see returns inside two quarters. SPCC reported 9X ROI within six months of deploying PlantOS™, and Hindustan Zinc Ltd (HZL) of Vedanta Group reported achieved $700K+ in savings as reported by Vedanta Spark. The return comes from prevented outages rather than from labour savings, which is why a single avoided stoppage on a critical line often covers the deployment.


    How is the accuracy of prescriptive AI software measured?

    Accuracy is measured by customer validation rather than by internal model scoring. Across the PlantOS™ install base, prescriptions run at 99.97 percent prediction accuracy, with up to 99 percent of them acted upon on the floor. Both numbers matter, because a platform with high accuracy and a low action rate has an adoption problem rather than a modelling problem.


    Can prescriptive maintenance be deployed across multiple plants?

    Yes, and multi-site groups gain the most from it. A single platform creates a common fault taxonomy and severity standard, so assets can be ranked by risk across the network and a proven prescription can be transferred between sites. JSW Steel runs PlantOS™ across 139 plants in India and the USA, and Coromandel International across 27.


    What size of plant justifies prescriptive AI software?

    Any site where a single unplanned outage on a critical line carries material production cost. Asset count matters less than production value per hour. In practice, one prevented outage on a kiln, mill, furnace, or main line tends to cover the platform for the year.

  • Widest Plant Reliability Coverage: Why Partial Visibility Is the Most Expensive Kind

    Widest Plant Reliability Coverage: Why Partial Visibility Is the Most Expensive Kind

    Widest Plant Reliability Coverage: Why Partial Visibility Is the Most Expensive Kind
    Why “Widest Plant Reliability Coverage” is the reliability conversation heavy industry needs to have

    Read Time: 8–9 minutes | Author – Kalyan Meduri

    Industrial technician using a tablet to monitor pump and motor performance in a manufacturing plant

    Ask a plant head which assets keep them awake at night, and they will name five without hesitating. The kiln. The rolling mill. The SAG mill. The main hoist crane. The compressor train. The paper machine.

    Now ask them what caused their last unplanned shutdown.

    It is rarely on that list.

    It was a conveyor drive nobody had instrumented. A dust-collector fan that had been running rough for months. A dewatering pump at the far end of the site that finally seized and backed up the circuit. The failure did not begin on the asset register’s A-list. It began somewhere unwatched, and it travelled.

    This is the central, uncomfortable truth of industrial reliability: failures do not respect your criticality ranking. And it is why the most important question in reliability today is no longer “how well are we monitoring our critical assets?” but “how much of this plant can we actually see?”

    What plant reliability actually means

    Most organisations still define reliability as a maintenance metric — MTBF, availability percentage, PM compliance. Useful numbers, but they describe the department, not the plant. A more honest definition, and the one asset-intensive industries are converging on, is this:

    THE DEFINITION THAT CHANGES THE CONVERSATION

    Plant reliability is the ability to deliver committed production outcomes — predictably, safely, and at planned cost.

    Notice what that does. It moves reliability out of the maintenance shop and into the P&L. It makes reliability a production concept, owned as much by operations and finance as by the reliability engineer. A plant that hits its availability target while burning unplanned overtime, expedited freight and premium-priced emergency parts is not reliable. It is expensive.

    Why this is urgent, not merely important

    Three pressures have converged on heavy industry at once.

    Assets are older and running harder. Equipment commissioned for one duty profile is being asked to deliver another, at higher throughput, with less slack in the schedule.

    Crews are leaner and more junior. The engineer who could diagnose a gearbox by walking past it is retiring — and the tribal knowledge is leaving with them.

    And the cost of an hour has gone up. In a large dry-process cement plant, an hour of unplanned rotary kiln outage carries roughly $120,000 in value at stake; a vertical raw mill around $80,000. In mining, SAG and ball mills run near $150,000 per hour, crushers around $90,000. These are not maintenance costs — they are production losses, increasingly written into customer contracts as uptime guarantees someone has to stand behind.

    Where traditional approaches fall short

    Most plants are not doing nothing. They have SCADA historians, condition-monitoring programmes, CMMS platforms, and increasingly some machine learning layered on top. And still the surprises keep coming. Three structural gaps explain why.

    The criticality trap.

    Conventional programmes concentrate instrumentation on a handful of A-class assets, because that is where the budget goes. But criticality is a statement about consequence, not about where failures start. A $5,000 bearing that fails undetected routinely takes the gearbox, motor and shaft with it — converting a minor part replacement into a six-figure rebuild. Coverage that stops at the A-list guarantees the C-list will eventually write the invoice.

    The sampling gap.

    Route-based monitoring and battery-powered sensors capture data a few times a day, on a clock. Equipment does not fail on a clock. It reveals its faults when it is loaded, hot and working — precisely the moments periodic sampling is least likely to catch. On assets that run in bursts, at ultra-slow speed, or in radiant heat, conventional sensing does not merely underperform. It goes blind.

    The last-mile gap.

    The most expensive gap, and the least discussed. Predictive maintenance outputs a probability — a risk score, a trend alert, a threshold breach. It does not identify which component, what fault mode, what evidence supports the conclusion, or what action to take by when. That diagnostic burden falls back on a team already stretched, which is exactly where alert fatigue is born and genuine warnings get lost.

    More data has not solved the reliability problem. More decisions have.

    What comprehensive coverage actually looks like

    Here is where most reliability strategies go wrong: they equate “comprehensive” with “uniform.”

    Instrument everything to the same depth and the business case collapses — nobody can justify deep-domain AI on a utility fan. Instrument only the crown jewels and you have bought a very good view of five machines in a plant that contains thousands.

    True coverage is neither. It is matched intensity — monitoring depth calibrated to asset criticality, so that every asset is covered by something appropriate, and nothing is covered by nothing. The principle is simple to state and hard to execute:

    THE COVERAGE PRINCIPLE

    From your most critical production assets to your most dispersed auxiliaries — full plant coverage, no over-spend.

    The four pillars of reliability in a modern plant

    Comprehensive coverage spans four dimensions, and a strategy that misses any one of them has a hole in it.

    Rotating equipment — motors, gearboxes, pumps, fans, drives. The heartland of condition monitoring, and still the largest single population of failure modes.

    Process-critical production assets — kilns, rolling mills, furnaces, reactors, mixers, extruders. These fail differently, because mechanical degradation and process conditions interact. A kiln girth-gear drive turning at 2 rpm under a 150°C shell is not a pump, and treating it like one is why so many programmes miss it.

    Utilities and balance of plant — compressed air, cooling, dust collection, effluent, packing. Individually low-consequence, collectively the origin of a startling share of unplanned events, and almost universally uninstrumented.

    The decision layer — the pillar most strategies forget entirely. Detection without prescription, and prescription without execution, produce no outcome. If a finding does not become a work order that someone completes and signs off, the programme has produced information, not reliability.

    MODERN PLANT RELIABILITY


    DECISION LAYER

    Diagnose
    ➔
    Prescribe
    ➔
    Execute


    ROTATING EQUIPMENT

    • Motors
    • Pumps
    • Fans
    • Gearboxes
    • Drives

    PROCESS-CRITICAL ASSETS

    • Kilns
    • Mills
    • Furnaces
    • Reactors
    • Extruders

    UTILITIES & BALANCE OF PLANT

    • Compressed Air
    • Cooling Systems
    • Dust Collectors
    • Utility Pumps
    • Packing Systems


    From reactive, to predictive, to prescriptive

    Most plants can locate themselves on a three-stage maturity curve.

    Reactive operations fix what breaks — and pay not just for the repair, but for the cascading damage, the expedited logistics, and the production never made up.

    Predictive operations know something is degrading. This is where most digitalisation programmes plateau: better data, better models, and a maintenance team still deciding what to do about a dashboard full of probabilities.

    Prescriptive operations close the loop. The system identifies the specific fault on the specific component, attaches the evidence supporting the diagnosis, recommends a specific corrective action within a specific timeframe, and tracks it through to execution and sign-off.

    The difference is not academic.

    PROOF IN PRODUCTION

    Leading integrated steel producer —
    36,108 hours of unplanned downtime eliminated across 139 plants, with 6,047 prescriptions executed at 99.75% prescription accuracy.

    Southern Province Cement Company —
    9X ROI in under six months, $175,105 in annual maintenance savings, 27,814 tons of production preserved, 100% prediction accuracy with zero missed faults.

    Metals & mining portfolio —
    17,965 hours of downtime eliminated and 4,089 breakdowns avoided across 85+ plants.

    The pattern is consistent: value is not created when a fault is detected. It is created when the right action is taken in time.

    How Infinite Uptime delivers the widest coverage

    This is where architecture matters. The PlantOS™ platform delivers reliability through four purpose-built solutions, each matched to a different tier of asset criticality and, critically, all four feeding a single prescriptive AI brain.

    01
    Flagship
    AI Shields
    Equipment-specific deep domain AI combining mechanical and process signals with dynamic FMEA — built for the assets whose failure stops the plant.
    Built for: Kilns · Mills · Cranes · Furnaces · Mixers · Extruders
    02
    Critical Equipment Reliability
    Always-on coverage engineered for the conditions that defeat conventional sensing: surface temperatures to 150°C, ultra-slow speeds down to 2 rpm, corrosive and harsh environments.
    Built for: Girth-gear drives · Mill drives · Slurry & process pumps · Large fans
    03
    Standard Equipment Reliability
    Flexible, fast-install wired or wireless MEMS coverage for the broad asset population — too numerous for deep instrumentation, too consequential to ignore.
    Built for: Conveyors · Pumps · Gearboxes · Feeders · Auxiliary drives
    04
    Non-Critical Equipment Monitoring
    Solar-powered wireless sensors, self-installed, no gateways required — extending visibility to dispersed balance-of-plant equipment that has been invisible by default.
    Built for: Utility fans · Dust collectors · Dewatering pumps · Tailings · Packing

    Four tiers. One plant. No blind spots, and no over-spend.

    But the tiers are not the differentiator. The unified decision layer is. Every one of the four solutions writes into the same prescriptive AI engine, which produces evidence-backed prescriptions, routes them as executable work orders, and tracks them through completion — the 99% Trust Loop, validated by the operators themselves.

    That is the difference between four monitoring products and one reliability ecosystem. Point solutions leave the integration problem — and the reliability gap it opens — on the customer’s side of the table.

    The competitive case for widest coverage

    Across 946 plants in 26 countries, this approach has eliminated 157,115 hours of unplanned downtime, with 99% of prescriptions acted upon by plant teams.

    946
    plants worldwide
    26
    countries
    157,115
    downtime hours eliminated
    99%
    of prescriptions acted upon

    The business impact compounds across every dimension leaders are measured on. Uptime, because failures are intercepted before they reach a shift. Productivity, because capacity lost to slow degradation is recovered. Safety, because catastrophic failures on cranes, furnaces and pressure systems are prevented rather than investigated. Maintenance optimisation, because scheduled intervention costs a fraction of emergency mobilisation. And profitability, because every one of the above lands in the same P&L.

    Partial reliability coverage is not a smaller version of complete coverage. It is a different thing entirely — a plant with known blind spots, waiting for one of them to prove expensive.

    The widest coverage wins, because the failure you cannot see is the only one you cannot prevent.

    Turn Every Asset Into a
    Validated Production Outcome.
    Monitoring non-critical equipment is only the first step. PlantOS™ combines wireless sensing, Prescriptive AI, and operator validation to transform hidden equipment risks into measurable production outcomes—reducing unplanned downtime, lowering maintenance costs, and improving throughput.

    Explore PlantOS™ →


    Request a Demo →

    Frequently Asked Questions


    What does “widest plant reliability coverage” mean?


    Widest plant reliability coverage means ensuring every asset in the plant is monitored at an appropriate level based on its criticality, so that no equipment remains invisible to the reliability program.


    Why isn’t monitoring only critical assets enough?


    Many unplanned shutdowns originate from non-critical or auxiliary equipment. While these assets may have lower individual importance, their failures can trigger larger production disruptions and costly downtime.


    What are the biggest gaps in traditional reliability programs?


    Traditional programs often suffer from three challenges: focusing only on critical assets, relying on periodic data collection that misses developing faults, and lacking actionable guidance for maintenance teams.


    How is prescriptive maintenance different from predictive maintenance?


    Predictive maintenance identifies that a problem may occur, whereas prescriptive maintenance identifies the likely fault, recommends corrective action, prioritizes urgency, and helps ensure execution.


    Which assets should be included in a plant reliability strategy?


    A comprehensive strategy should cover rotating equipment, process-critical assets, utilities and balance-of-plant equipment, and the decision layer that converts insights into action.


    How does wider coverage improve ROI?


    Broader visibility helps detect failures earlier, reduce emergency repairs, avoid production losses, improve maintenance planning, and increase equipment availability.


    What industries benefit most from comprehensive reliability coverage?


    Industries such as steel, metals and mining, cement, chemicals, power generation, paper, and food & beverage can significantly benefit from plant-wide reliability coverage.


    Why are auxiliary assets important for reliability?


    Assets such as utility fans, dust collectors, dewatering pumps, and packing equipment are often overlooked but can become single points of failure that impact production continuity.

  • The 90% Problem: Why “Non-Critical” Equipment Is Quietly Draining Your Maintenance Budget

    The 90% Problem: Why “Non-Critical” Equipment Is Quietly Draining Your Maintenance Budget

    The 90% Problem: Why “Non-Critical” Equipment Is Quietly Draining Your Maintenance Budget
    A closer look at the equipment nobody’s watching – and what changes once you finally can.

    Read Time: 8–9 minutes | Author – Kalyan Meduri

    The 90% Problem: Why "Non-Critical" Equipment Is Quietly Draining Your Maintenance Budget

    It’s 2 a.m. on a Tuesday. A conveyor motor tucked into a corner of the packaging line – the kind of asset nobody’s really looked at in months – seizes up without warning. Production doesn’t stop. But a shift supervisor gets pulled off more important work to deal with it, a technician gets called in on overtime, and a spare part gets rush-ordered at three times what it would’ve cost on a normal schedule.


    None of that makes it into an incident report. It’s not a line-down event. Nobody writes it up. It’s just Tuesday. And honestly, that’s the part worth paying attention to.


    Ask any plant’s reliability team which equipment matters most, and they’ll rattle off the same handful of names without thinking twice – the extruder, the reactor, the compressor train. The stuff that actually stops the line if it goes down. Now ask how many other motors, pumps, fans and conveyors are running in that same plant. Most of the time, nobody’s even counted. Because nobody’s watching.


    That’s the gap. A small, well-instrumented core of “critical” equipment, and a much bigger, mostly dark periphery of everything else – equipment that was never worth the wiring or the extra headcount to monitor. On its own, none of it can bring your plant down. Together, it adds up to a slow, steady drain most budgets never quite trace back to its source.


    A Typical Plant’s Equipment: Who’s Actually Being Watched?


    ~0%
    of plant assets

    Instrumented & closely monitored
    Running with little or no monitoring

    Illustrative — proportions vary by plant; most facilities concentrate monitoring on a small critical-asset core.

    Most plants concentrate monitoring on a small critical-asset core, leaving the rest of the plant largely unwatched.


    “Non-Critical” Was Never the Same Thing as “Doesn’t Matter”

    The label itself is a bit misleading. “Non-critical” tends to get read as “safe to ignore,” when what it really means is: this one asset won’t stop the line by itself, but there are hundreds like it, and each one is going to fail sooner or later.

    Stack that up across a whole facility and here’s roughly what you’re looking at:

    • Manual inspection rounds that eat up hours every week – walking the same routes, checking the same gauges, usually finding nothing, until the one time it matters.
    • Surprise failures on equipment nobody was tracking, each one a small fire that pulls someone off planned work.
    • Compliance headaches in regulated settings – an F&B line under FSMA and HACCP, or a chemicals plant under EPA process safety rules, where an unmonitored pump isn’t just a maintenance blind spot, it’s a paperwork problem too.
    • A maintenance team that’s already stretched, somehow expected to cover ten times the equipment without ten times the people.

    None of this shows up as one dramatic outage on a quarterly report. It shows up as a hundred small cuts to your maintenance spend – which is exactly why it’s so easy to miss, and so costly to keep missing.

    Why This Hasn’t Been Fixed Already

    It’s not that plants don’t want to monitor this equipment. It’s that the numbers never worked in favor of doing it. Wired sensors mean running cable to assets that were never built for it. Wireless sensors usually mean battery swaps across hundreds of scattered units. And most industrial sensors assume a gateway and solid Wi-Fi nearby – infrastructure that balance-of-plant equipment, scattered across a facility, often just doesn’t have.


    So the math has always come out the same way: monitoring the long tail of equipment costs more, in capital and complexity, than the failures it actually prevents. For a long time, that was a fair trade-off. It’s the reason so much equipment has stayed dark for years – not neglect, just arithmetic that didn’t add up.

    WHERE INFISENSE 3XT COMES IN

    This is the piece that actually changes the math. InfiSense 3XT is Infinite Uptime’s wireless reliability sensor, built specifically for non-critical and balance-of-plant equipment – designed around one hard constraint: you simply can’t treat 500 non-critical assets the way you treat your five critical ones.

    No batteries.
    No wiring. No gateway.

    Runs on harvested ambient light, indoors or out, and connects straight over built-in cellular — so it doesn’t need your plant Wi-Fi to reach every corner where a stray conveyor motor happens to live.

    Install time is minutes,
    not a project.

    Magnet-mount it on the asset, it connects over cellular, and prescriptions start flowing into PlantOS™. No specialist crew, no weeks-long commissioning plan.

    Prescriptions,
    not another dashboard.

    Feeds into the same prescriptive AI layer as the rest of the platform, so your team gets a specific, actionable fault call — not raw vibration data someone still has to sit down and interpret.

    Built for regulated,
    high-volume plants.

    FSMA/HACCP-friendly coverage for food & beverage, EPA-conscious coverage for chemicals, and an ATEX-certified version for hazardous areas.

    What a Day Without the Blind Spot Actually Looks Like

    Go back to that same conveyor motor, three weeks earlier this time. A prescription lands in the maintenance queue on a normal Wednesday afternoon: early-stage bearing wear, replace it during the next scheduled window. No overtime call. No rushed part. No one pulled off the floor at 2 a.m. Just a five-minute job, done on someone’s own schedule, that never gets the chance to become an emergency.


    Multiply that across the hundreds of motors, pumps and fans quietly running in the background of most plants, and the change isn’t only financial. It’s a bit of a culture shift too – maintenance stops being a constant scramble and starts looking more like what it was always meant to be: planned, predictable, and honestly, a little boring.

    This Isn’t Hypothetical

    Two real signals worth pointing to – one from a plant floor, one from the trade press.

    CHEMICALS & FERTILIZER

    India’s Leading Fertilizer Producer – 550 Monitoring Points Across 27 Plants

    One of India’s leading fertilizer producers scaled monitoring to 550 points across 27 plants, including ATEX-certified sensors on hazardous units and continuous coverage of centrifugal and process pumps, scrubbers, and evaporator circulation systems—the kind of auxiliary, balance-of-plant equipment this piece is about, not just the headline critical assets. The result: 3,210 hours recovered, 940 breakdowns avoided, and mean time between repairs extended to 941 hours, all validated by the company’s own engineering team.

    Source:

    infinite-uptime.com

    FOOD & BEVERAGE

    The trade press is catching up to this exact problem

    A June 2026 feature in Food Engineering makes almost precisely this case: conveyors, motors and gearboxes typically get filed under “low-criticality” equipment, yet collectively they’re one of the biggest blind spots in a plant’s maintenance strategy. The article points to the same shift this piece is built around—wireless sensors and cloud-based AI making it finally practical to cover equipment that traditional condition-monitoring systems were historically too complex and costly to deploy across at scale.

    Source:
    Mikko Nurmimäki, “How Conveyor Monitoring Can Cut Costs, Prevent Downtime in Food Manufacturing,
    ” Food Engineering, June 29, 2026.

    What This Actually Buys You

    Coverage at this scale changes what “maintenance” means day to day. Manual inspection rounds – typically four-plus hours a year per piece of equipment – get reclaimed for higher-value work. Instead of finding out a secondary pump failed after it already disrupted a shift, you find out before it happens.


    There’s also a second benefit that’s easy to miss the first time you look at this: it’s not really a standalone tool, it’s a coverage layer. Paired with AI Shields on your critical assets, InfiSense 3XT gives you something most plants have genuinely never had – visibility across the whole plant, not just the handful of machines everyone already watches closely. The failures that used to hide in the gaps between instrumented assets don’t really have anywhere left to hide.

    The Real Question Isn’t “Is This Equipment Critical?”

    It’s: how much of your plant are you currently running blind on?


    Every plant knows its five most critical machines inside and out. Almost none know what their two-hundredth most important motor is doing right now – and that’s not a knock on the maintenance team. It’s just a reflection of what monitoring used to cost to deploy at that scale.


    That constraint doesn’t really hold anymore. What’s left is a fairly simple choice: keep budgeting for the surprises, or start seeing them coming.

    Turn Every Asset Into a
    Validated Production Outcome.
    Monitoring non-critical equipment is only the first step. PlantOS™ combines wireless sensing, Prescriptive AI, and operator validation to transform hidden equipment risks into measurable production outcomes—reducing unplanned downtime, lowering maintenance costs, and improving throughput.

    Explore PlantOS™ →


    Request a Demo →

    Frequently Asked Questions


    What is non-critical equipment?

    Non-critical equipment refers to assets that do not immediately stop production if they fail but are essential for smooth plant operations. Examples include conveyor motors, pumps, fans, blowers, gearboxes, and auxiliary drives. While a single failure may have limited impact, repeated failures across many non-critical assets can increase maintenance costs, reduce operational efficiency, and create unexpected downtime.


    Why should non-critical equipment be monitored?

    Monitoring non-critical equipment helps detect early signs of wear, imbalance, misalignment, and bearing failures before they become costly breakdowns. Continuous condition monitoring reduces emergency repairs, improves maintenance planning, extends asset life, and allows maintenance teams to focus on planned work instead of reacting to unexpected failures.


    What exactly is InfiSense 3XT?

     It’s Infinite Uptime’s wireless sensor for non-critical and balance-of-plant equipment — pumps, fans, conveyors and similar assets – designed to be self-powered and quick to deploy at scale.


    How is this different from the vibration sensors we already use?

     Most sensors on the market still lean on batteries and a nearby gateway or Wi-Fi network. InfiSense skips both – it’s energy-harvesting and connects over built-in cellular, and it sends prescriptions rather than raw sensor data.


    Do we need to run new network infrastructure to use it?

     No. That’s really the point – no gateway, no Wi-Fi dependency. It connects directly over cellular, which is what makes covering equipment scattered around a plant realistic.


    Is it suitable for hazardous areas?

    There’s an ATEX-certified version available for hazardous-area deployments, alongside the standard version for general use.


    How long does it take to see results?

    Installation itself is a magnet-mount job measured in minutes. From there, it depends on the asset and failure mode, but the model is built around fast time-to-first-prescription rather than a long commissioning cycle.


    How much could this actually save us?

    It varies a lot by plant. The example figures in this piece are illustrative, based on a mid-sized facility with around 500 assets – your real number will depend on your specific equipment mix and current maintenance setup.

  • Your Crane Works Hardest at 2 PM. Your Sensor Goes to Sleep at 9 AM.

    Your Crane Works Hardest at 2 PM. Your Sensor Goes to Sleep at 9 AM.

    Your Crane Works Hardest at 2 PM.

    Your Sensor Goes to Sleep at 9 AM.
    The fault doesn’t wait for your monitoring window. Neither should your monitoring.

    Read Time: 8–9 minutes | Author – Chaiitanya Bulusu

    Double girder overhead bridge crane with electric wire rope hoist, motorized trolley, and end carriages for heavy-duty industrial lifting applications.

    The Short Version

    A battery-sampled PdM sensor wakes a few times a day. Your EOT crane’s main hoist motor runs 300–400 lift cycles a shift. Those two schedules do not overlap – and the mismatch is where the failures hide.

    At a leading steel manufacturing plant, a main hoist motor bearing spent 90 days building toward seizure. Vibration rose from 35 to 190 (m/s²)². Every inspection cleared it. The crane kept lifting. The signal was there the entire time – just not in any window any sensor was open to read it.

    Crane AI Shield watches at the right moment – RPM-gated, always-on, and built to survive the foundry floor – then hands your operator a prescription, not another alert to chase.

    The Sensor That Sleeps Through the Shift

    You are the reliability manager. Your EOT crane’s main hoist has been cleared on every round – brakes, wire rope, hooks, limit switches, gearbox oil. The operator reports nothing. The crane lifts.


    But lift cycles are not inspections. A single melt-shop EOT crane runs 300–400 of them a shift. Each one loads the main hoist motor’s drive-end bearing – shock of the pick, reversal of the lower, dead-weight hang of the hold. The bearing accumulates every cycle. The inspection schedule does not.


    Now consider what your battery-sampled PdM sensor is doing during those 400 cycles. It woke at 9 AM, sampled for a few seconds, and went back to sleep. It will wake again at 3 PM, at 9 PM, at 3 AM. Four windows in 24 hours. Roughly one observation per 100 lift cycles.


    The fault that will stop your bay does not announce itself in those four windows. It announces itself under load, at stable speed, mid-lift – exactly when the bearing stress is highest and the signal is clearest. The sensor is asleep.


    Fault emerges

    Crane lift cycles
    300-400 per shift · continuous under load
    ~350 lift cycles/shift


    Battery PdM sensor
    4 sample windows per day
    ~6 hrs apart

    Battery PdM sensor
    4 sample windows per day


    ~6 hrs apart
    fault signal present
    but no sensor reading


    S1
    S2
    gap — 6 hrs
    sensor asleep
    S3
    S4

    00:00
    06:00
    12:00
    18:00
    24:00

    Each bar = one lift cycle
    Battery sensor sample window
    Fault missed in gap

    One 24-hour shift · EOT crane main hoist

    The sensor samples 4x a day. The fault doesn’t wait.


    Ninety Days. No Symptom. No Alarm. A Rising Signal Nobody Read.

    At a leading steel manufacturing plant melt shop, a charging EOT crane ran its main hoist through a full quarter of production without a single maintenance flag. The crane passed every check. The operator reported nothing unusual. By any measure available to the maintenance team, the crane was healthy.


    PlantOS™ Crane AI Shield saw something different.


    From late September 2025, the drive-end bearing’s total acceleration held at a baseline of around 35 (m/s²)². Through October and November – two full months – the trend rose steadily. No operational symptom. No trip. No alarm. Just a number climbing, cycle by cycle, invisible to everything except a system that was watching every cycle continuously.


    By 28 December, the spectrum confirmed what the trend had been saying for weeks: 46.66 Hz harmonics, impact peaks near 8G. On 29 December, total acceleration peaked at 190 (m/s²)² – more than five times baseline. Crane AI Shield issued the prescription: bearing looseness, drive-end and non-drive-end, lubrication required.


    On 3 February 2026, the re-lubrication was completed during a planned maintenance window – one stop, scheduled, without touching a single production shift. Horizontal vibration velocity collapsed from 10.45 mm/s to 0.30 mm/s – a 97% reduction confirmed by post-repair monitoring. The crane went back to work.

    90
    of continuous fault progression
    — no operational symptom
    5×
    Acceleration rise: 35 → 190 (m/s²)²
    before prescription issued
    97%
    Vibration reduction post re-lube
    10.45 → 0.30 mm/s

    It’s Not About More Data. It’s About Data at the Right Moment.

    The bearing had a signal for 90 days. That is not a detection failure – it is a timing failure. A battery-sampled sensor waking four times a day would have seen that trend if it was awake when the load was on. It was not.


    This is the structural problem with applying standard PdM to a crane. Three gaps open up the moment you put a time-sampled sensor on a duty-cycle asset:


    It wakes on a clock, not on a load: Faults reveal themselves under stress, not at rest. A sensor that samples on a schedule samples the wrong moments.


    It goes quiet under load: Many systems stop recording when the asset draws peak current – which is precisely when the fault signature in the bearing is strongest.


    It dies before it can warn you: Sealed battery units degrade under foundry heat, dust, and the vibration of the floor. The sensor that failed last Tuesday was not monitoring your bearing before it happened.


    The answer is not more frequent sampling. It is fundamentally different timing. Crane AI Shield captures vibration only when the motor is inside a stable RPM band – under load, not on a clock. The spectrum is clean because the accel/decel noise is not in it. The fault signature is clear because the data is taken at the exact moment the fault is loudest.

    Why One Signal is Never Enough

    The bearing did not announce itself on a single chart. The acceleration trend was rising – but acceleration alone could mean many things. What confirmed the diagnosis was the agreement between multiple signal streams: 46.66 Hz harmonic content in the FFT spectrum, impact peaks in the shockwave, RPM tracking confirming the frequency was load-correlated.


    Crane AI Shield continuously reads and cross-correlates gear-mesh frequencies, sidebands, time waveform, shockwave and envelope, PSD, RPM, temperature, and velocity. Confidence builds only as the evidence agrees – validated by a certified analyst before anything reaches your floor. A single rising number is a prompt. Eight signals agreeing is a prescription.

    FFT vibration analysis spectrum displaying vibration velocity in mm/s across frequencies from 0 to 1300 Hz, with prominent peaks near 175 Hz and 460 Hz.

    From Detection to Closed Loop – Without a Crisis in Between

    The difference between the above instance’s outcome and a bay stoppage was not luck. It was the loop:


    Contextualize: Every crane is ranked by fault progression in real time. The melt-shop EOT crane moved up the list as its bearing trended.


    Predict & Prescribe: PlantOS™ did not say ‘check bearing.’ It said: looseness confirmed at DE and NDE, re-lubrication required, urgency level and timing window specified.


    Validate: Maintenance completed the re-lube during a planned window. Post-repair monitoring confirmed the 97% vibration reduction.


    Loop Closed: The confirmed outcome feeds back into the model. The next prescription is sharper than the last.


    Industrial crane predictive maintenance dashboard displaying three cranes needing attention, maintenance recommendations, downtime metrics, and a list of open prescriptions.

    The 99% Trust Loop UI – Contextualize → Predict & Prescribe → Validate → Loop closed.

    No emergency stop. No crisis room. No call in the dark. The crane’s highest-consequence failure mode – a main hoist bearing seizure with a suspended load – became a scheduled re-lube on a Tuesday morning.

    Built to Survive Where the Signal Matters Most

    Getting the timing right means nothing if the hardware cannot survive long enough to take the reading. The foundry floor is not a controlled environment. The ambient temperature around a melt-shop EOT crane runs hot enough to destroy standard battery-enclosures. The dust is conductive. The vibration is constant.


    Crane AI Shield runs on IP68 SS316 sensors with 180°C-rated cabling – stud or bracket mounted, no adhesive, no batteries. The same sensor that read the bearing through 90 days of rising acceleration was on the motor the entire time: through the heat of every ladle, the shock of every lift, the electromagnetic interference of the furnace bay.


    The sensor did not degrade. The reading did not drop out. The trend was continuous because the hardware was continuous.

    The Bottom Line

    Your EOT crane works hardest between inspections. The bearing that is building toward seizure right now is not making a sound your team can hear – but it is producing a signal that Crane AI Shield is designed to read, at the exact moment it is most readable, continuously, without a sampling gap between it and the next alarm.


    Above crane ran 90 days with a rising signal. One planned stop. One re-lube. No bay stoppage. No emergency call.


    That is what monitoring at the right moment looks like.

    If your sensor is sampling on a clock, it is not watching your crane. It is watching the clock.


    Try PlantOS™ Crane AI Shield today:
    infinite-uptime.com/contact

    Frequently Asked Questions


    What is wrong with standard battery PdM sensors on cranes?

    Standard battery PdM sensors fail cranes in three specific ways: they sample vibration only a few times per day, missing faults that develop between snapshots; they stop recording when the crane is under load — exactly when fault signatures are strongest; and their battery enclosures degrade rapidly under foundry heat, dust, and vibration. Crane AI Shield eliminates all three: RPM-gated FFT fires only under stable load conditions, sensors stream RPM and temperature 24/7, and IP68 SS316 hardware with 180°C-rated cabling is designed to survive where battery units fail.


    What makes RPM-gated FFT better than time-sampled vibration monitoring?

    Time-sampled monitoring captures vibration on a clock schedule — not when the crane is actually working. Accel and decel noise contaminates the spectrum, making it difficult to isolate genuine fault frequencies. RPM-gated FFT triggers only when the motor is in a stable speed band under load — producing clean spectra at the exact moment fault signatures are most distinguishable. This eliminates false alarms, reduces filtering requirements, and catches faults that time-sampled systems structurally cannot detect.


    What types of failures can Crane AI Shield detect, and how early?

    Crane AI Shield monitors up to 19 failure modes across the main hoist drive train: bearing defects (BPFO/BPFI/BSF), gear-mesh faults (GMF), gear tooth wear, gear backlash, shaft misalignment, coupling faults, rotor bar cracks, unbalance, structural looseness, and more. The Comprehensive tier adds long-travel wheel bearing defects. Vibration analysis using FFT fault frequency mapping identifies bearing and gearbox degradation 2–6 weeks before catastrophic failure. The Tata Steel Colors case study: Main Hoist Motor #3 flagged 12 days before likely failure — 10 hours of unplanned downtime avoided.


    How long does deployment take and what is the expected ROI?

    Deployment follows a structured 5-day plan with only one day of crane downtime required for sensor mounting and commissioning sign-off. AI calibration to the crane’s kinematic profile — mapping gear-mesh and shaft-order frequencies — is completed within Days 2–3. The system delivers a first diagnostic typically within 30 days, with a 60-day evaluation period and 75% of payment due only on satisfaction. ROI payback is typically achieved within 6–12 months: the Standard subscription is $24K per crane per year versus $75K–$250K+ per avoided main-hoist failure — a 3–10× return on the first catch.


    Can PlantOS™ scale from a single pilot crane to an entire fleet?

    Yes. Start with your highest-criticality crane, validate the outcome on your specific equipment, then scale at your own pace. The Fleet Operations Center provides a unified view of 100+ cranes — every crane needing attention ranked by fault progression, with preventable downtime hours tracked live. Infinite Uptime currently operates across 845+ plants in 30+ countries. Sensor placement scales with crane size; the scope of fault coverage does not change.