Plant Reliability Beyond Mechanical Faults
How Process & Electrical Faults Drain Throughput, Energy, and Margin
Before a Single Alarm Fires
Read Time: 8–9 minutes | Author – Kalyan Meduri
Key Highlights
- Cement plants silently bleed 10–20% throughput and 5–8% additional energy when
mechanical, electrical, and process faults go undetected across VRMs, preheaters, kilns, and
fans—often weeks before a single alarm fire. - Start Cement India & several leading cement manufacturers deployed PlantOS™ and the
99% Trust Loop™ to intercept three fault events before they cascaded: VRM classifier
bearing distress, a false Preheater ID Fan sensor trip, and Kiln hood draft reversal. - At Star Cement India alone, PlantOS™ preserved 46 hours of production, recovered ≈600
tons of clinker output, and avoided 920K kCal of specific heat waste—each with a digitally
validated prescription, not a hypothesis. Delivering 10X RoI within 6 months.
PlantOS™ Outcomes Footprint — As of 17 March 2026; Digitally verifiable live on PlantOS™ Digital Reporting System
Plants Digitalized
9 industrial verticals globally
0
Downtime Hours Saved
globally (all verticals)
0
Cement Plants
digitalized
0
Cement Hours
downtime eliminated
0
Payback
vs 18–24 months industry average
<=6 Mo
All verticals: 881 plants across 9 industrial verticals globally. Cement vertical: 137 plants, 30,459 hours eliminated, 9,312 breakdowns
avoided. Payback: <=6 months vs. typical digital projects 18–24 months.
Prescriptive AI for Cement Plants: From VRM Gearbox Failures to
Preheater Trips to Kiln Hood Draft Instability
For a mid-size cement plant, a single unplanned outage costs $20,000–$300,000+ per day in lost production.
Across a year, that compounds to $2–5 million in preventable losses—most of it traceable to faults that were
detectable weeks or months before any alarm fired. VRM gearbox failures alone carry $500K–1.2M in repair
costs and 3–6-week lead times. A preheater ID fan trip can cascade to 245 TPH of kiln feed loss in minutes.
Restart energy penalties add $3,000–8,000 per incident.
This document walks through three distinct fault families—mechanical, electrical, and process—through the lens
of Star Cement India and leading cement manufacturers globally, showing precisely how PlantOS™ intercepted
each fault before it hit the P&L, and what the verified operational outcome was.
Mechanical Faults in Cement Vertical Roller Mills (VRMs)01
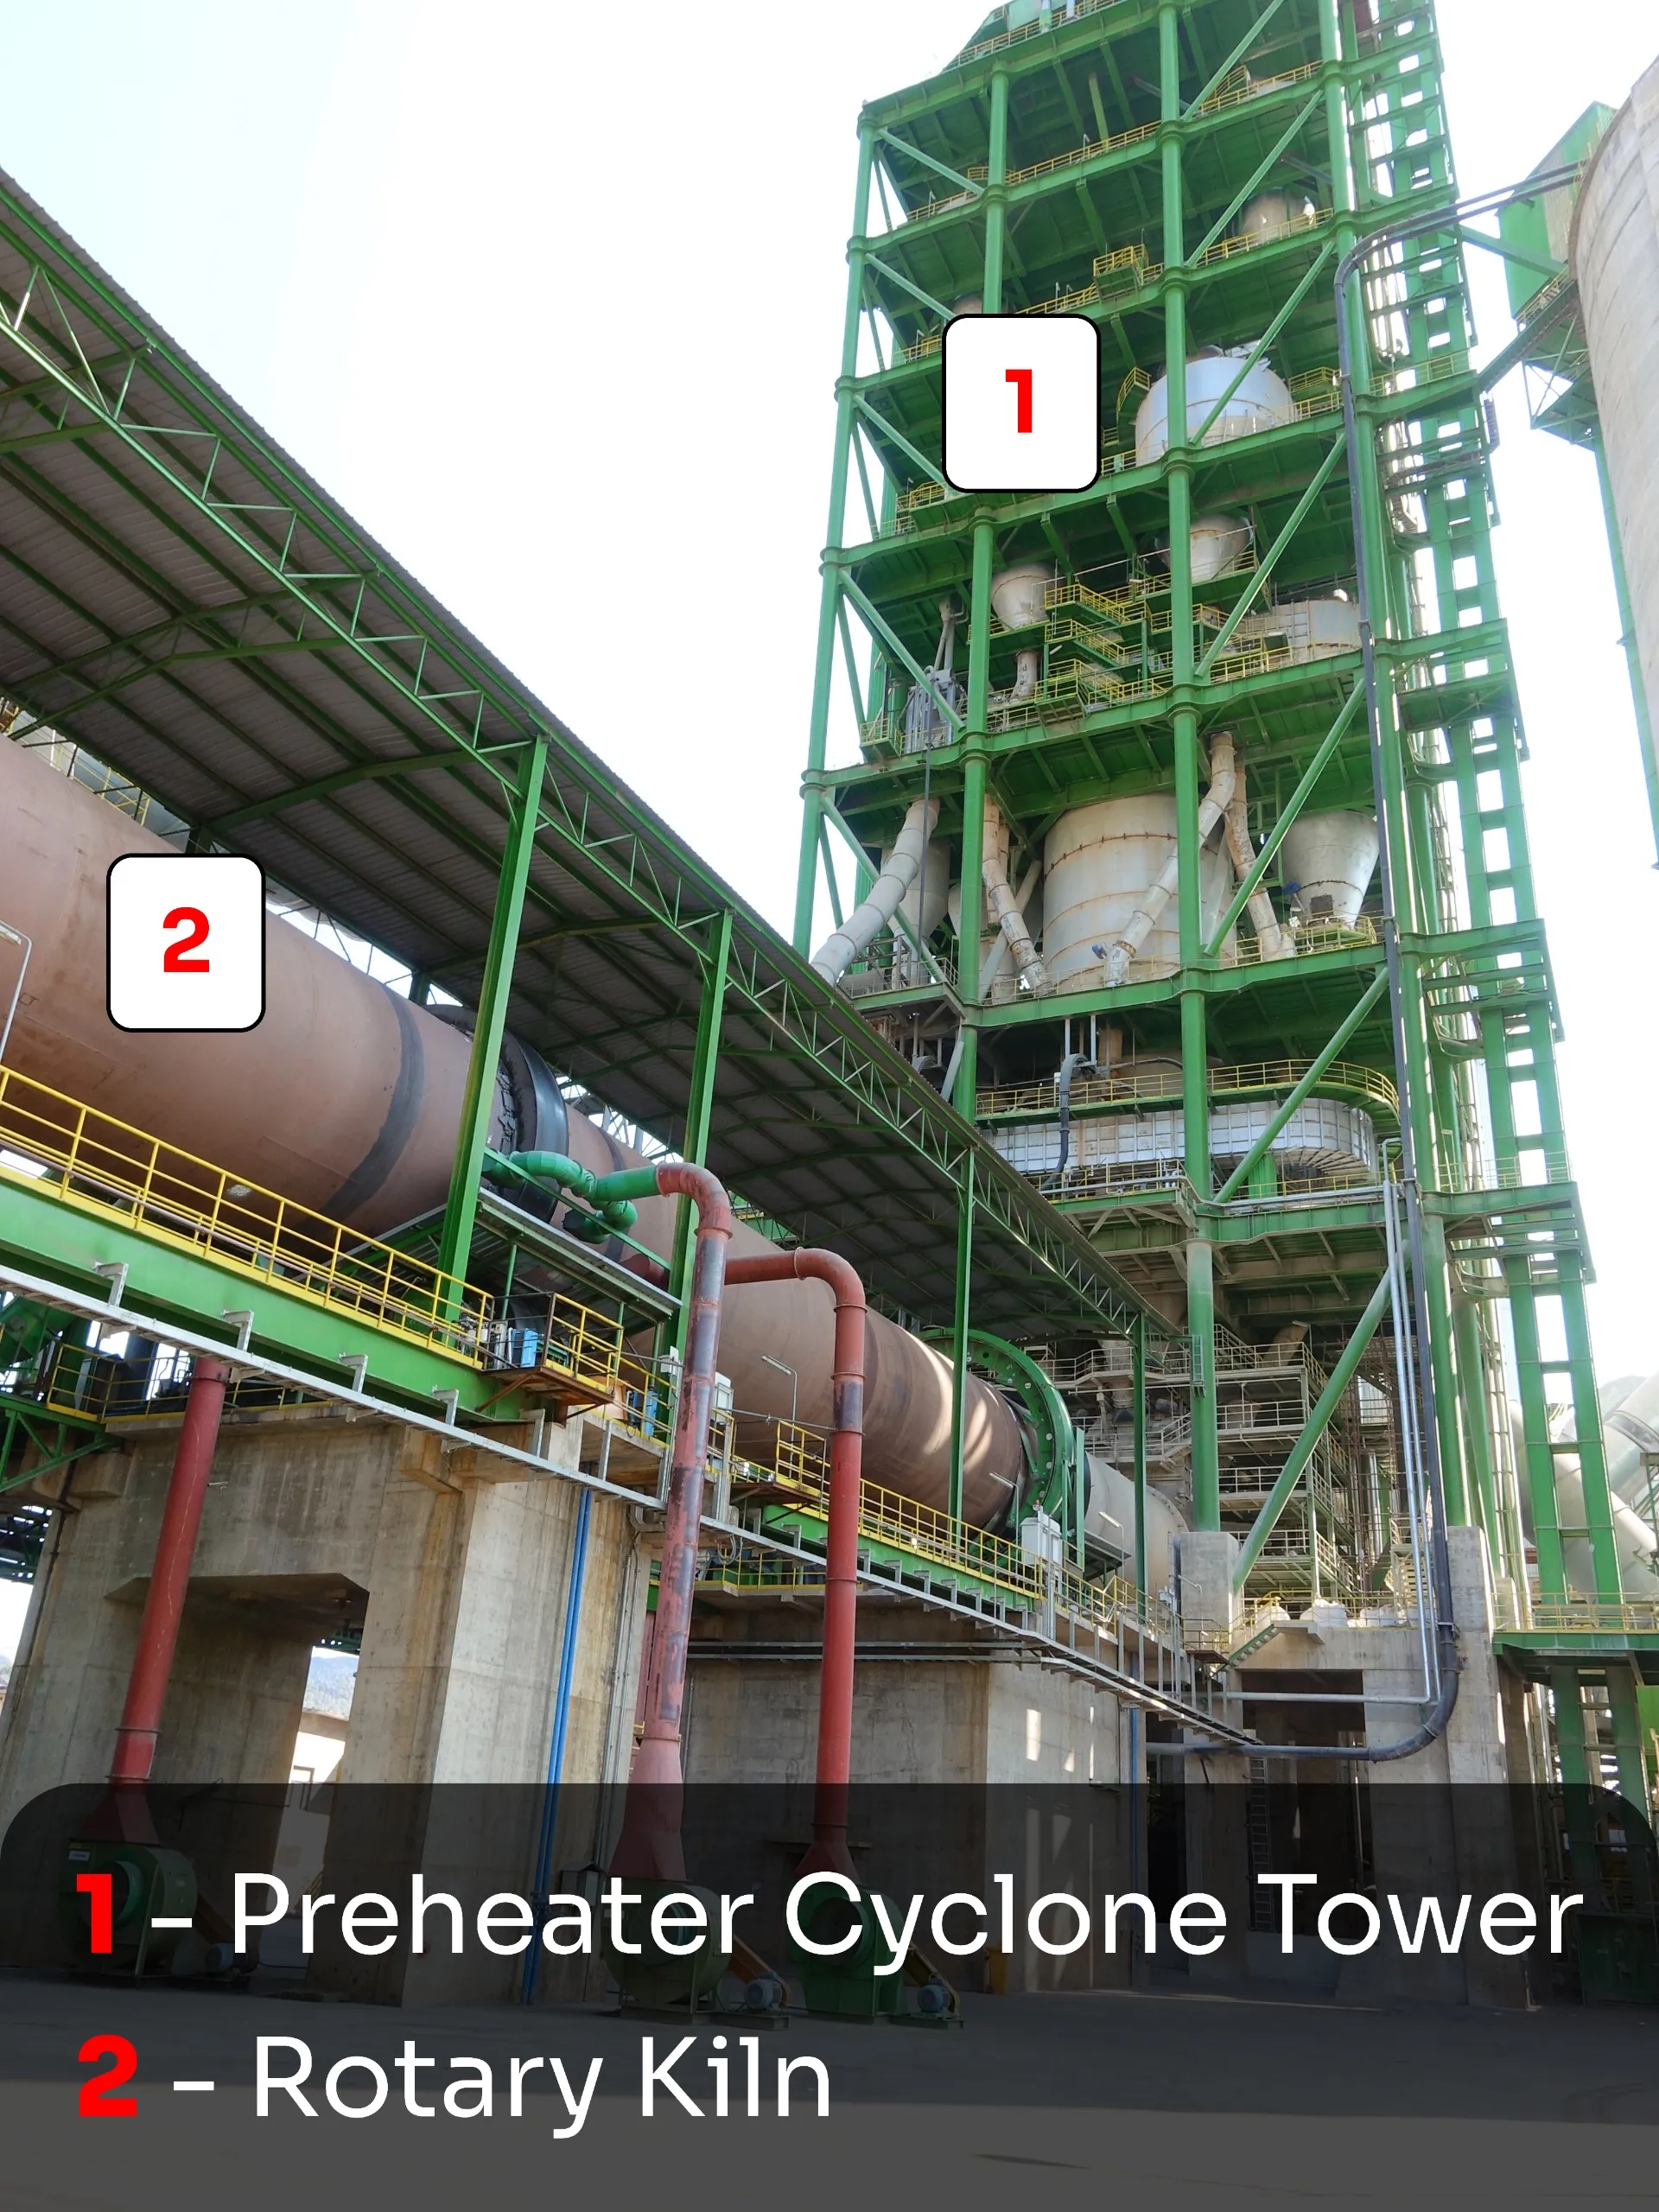
VRMs handle raw meal grinding at the front of the production line. The classifier motor at the mill top separates
fines from coarse material; its Drive End (DE) and Non-Drive End (NDE) bearings are high-load, high-speed, and
intolerant of lubrication gaps. Bearing distress manifests as rising acceleration (m/s²)² values well before a
catastrophic failure—the window for intervention is wide, but only if sensing and analytics are present.
Common mechanical fault modes:
- Bearing lubrication deficiency: Dry NDE/DE bearings spike broadband acceleration.
- Misalignment: Motor-gearbox coupling gaps drive velocity peaks.
- Roller/table wear: kHz-range impacts from spalling under load.
- Gearbox degradation: Planetary wear generating characteristic BPFO harmonics.
Live Incident: Classifier Motor Bearing Distress
PlantOS™ flagged rising vibration on the VRM classifier motor NDE/DE bearings—peak amplitudes reached
87.03 (m/s²)² (NDE) and 15.87 (m/s²)² (DE), with axial velocity at 2.18 mm/s pre-repair. Left unaddressed,
classifier failure coarsens raw meal beyond the 90-micron threshold, disrupting preheater and kiln feed. Estimated
downtime: 3+ hours for motor teardown and reassembly.Root cause (99% Trust Loop diagnosis):False reading from a faulty sensor and loose terminal connection—not true bearing overheat. Real bearing
temperatures do not spike 68°C without concurrent vibration or current precursors. The sensor fault mimicked
catastrophic failure, and the PLC acted on bad data.
Verified actions and outcome:
- Re-lubricated NDE and DE bearings Grease matched to bearing designation (SKF 6312).
- Scheduled maintenance: Weekly greasing and alignment checks; velocity trending established as baseline.
- Post-repair results: Axial velocity stabilized at 8.54 mm/s; horizontal 10.50 mm/s; vertical 7.28 mm/s—all within operational norms.

Classifier Motor Vibration (mm/s): Before & After Lubrication RepairBusiness Impact: 3 hours downtime prevented. Raw mill reliability maintained. Zero production loss
from bearing failure.
Electrical Fault in Cement Preheater ID Fans02
Preheater towers use hot kiln exhaust gases (~1,000°C) to preheat raw meal to ~900°C across 4–6 cyclone
stages, cutting fuel consumption 20–30%. The Induced Draught (ID) fans at the preheater base maintain the
negative draft (-200 to -300 mmWG per stage) that makes this possible. A sensor fault here doesn’t just stop a
fan—it starves the kiln.
Live Incident: False Temperature Trip, Real Production Loss
Preheater Fan 2 auto-tripped after a DE bearing temperature reading jumped from 51°C to 119.6°C within
minutes. Protective PLC logic halted the fan (850 RPM → 0 RPM) to prevent perceived bearing overheat. The
consequences were immediate:
- Cyclone cone pressure on PH string 2 collapsed from -219 mmWG to -30 mmWG—gases could no longer transport raw meal.
- Kiln feed crashed from 395 TPH to 150 TPH; main drive power fell from 390 kW to 70 kW.
- Net shortfall: 245 TPH—hours of clinker output gone.
Root cause (99% Trust Loop diagnosis):False reading from a faulty sensor and loose terminal connection—not true bearing overheat. Real bearing
temperatures do not spike 68°C without concurrent vibration or current precursors. The sensor fault mimicked
catastrophic failure, and the PLC acted on bad data.
Verified actions and outcome:
- Replaced the terminal block; tested continuity end-to-end with a multi-meter.
- Updated PLC logic: faulty sensor signals now surface as “NA/0 + alarm” without triggering auto-trip on non-HT fans.
- Implemented quarterly RTD calibration on critical HT ID fans as standard protocol.
- Post-fix monitoring over 24–48 hours confirmed: draft restored to -219 mmWG, temperature stabilized at ~51°C, kiln feed held at 395 TPH.
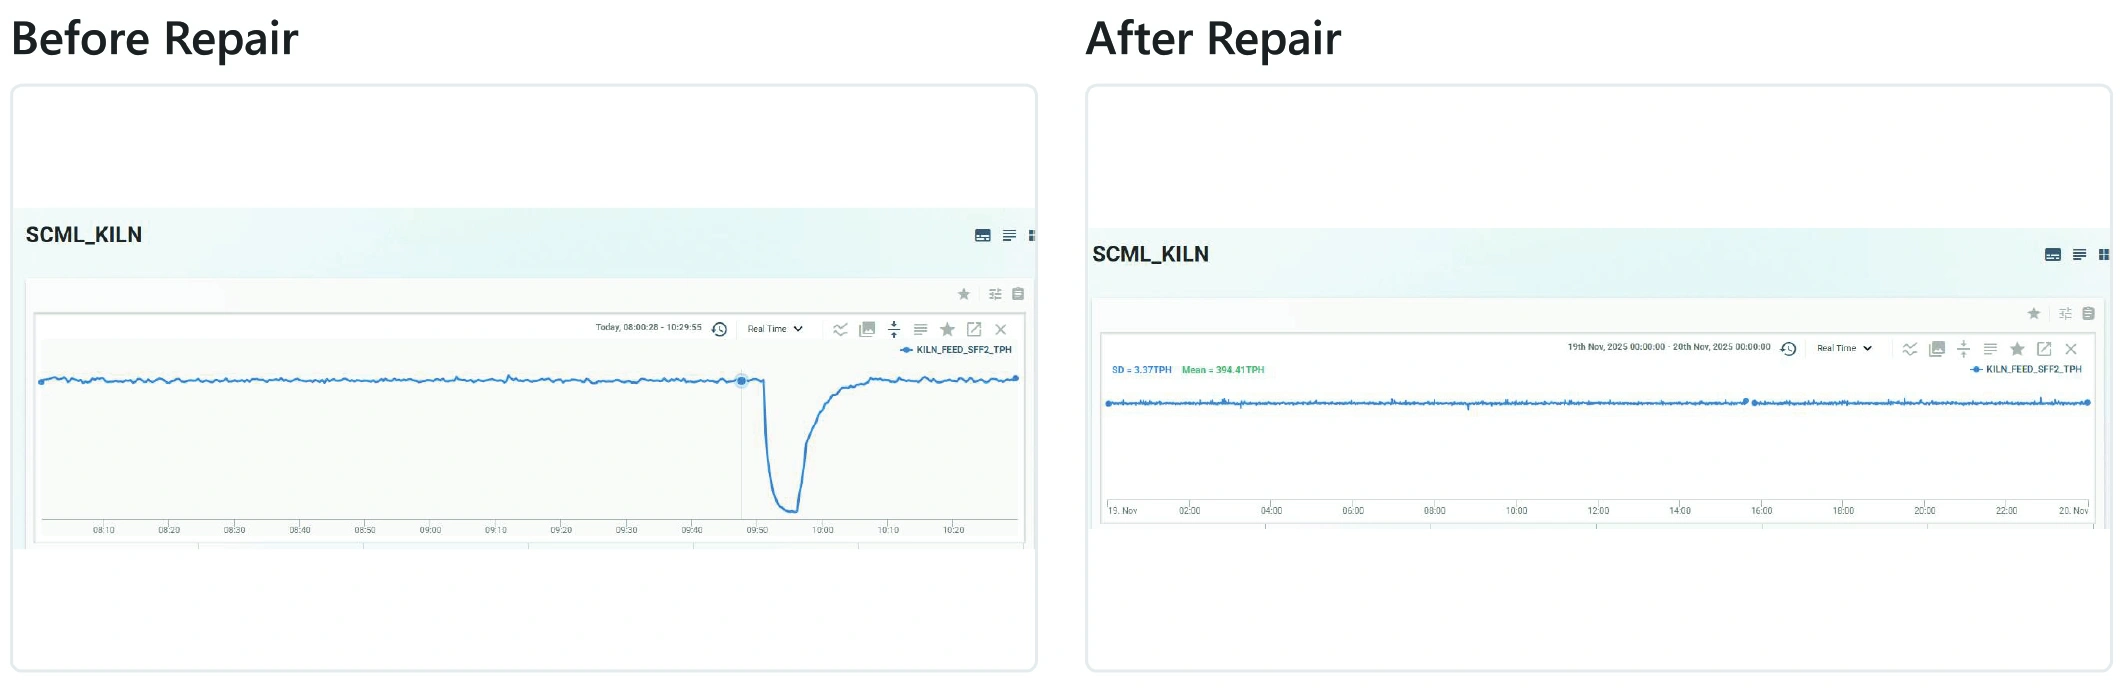
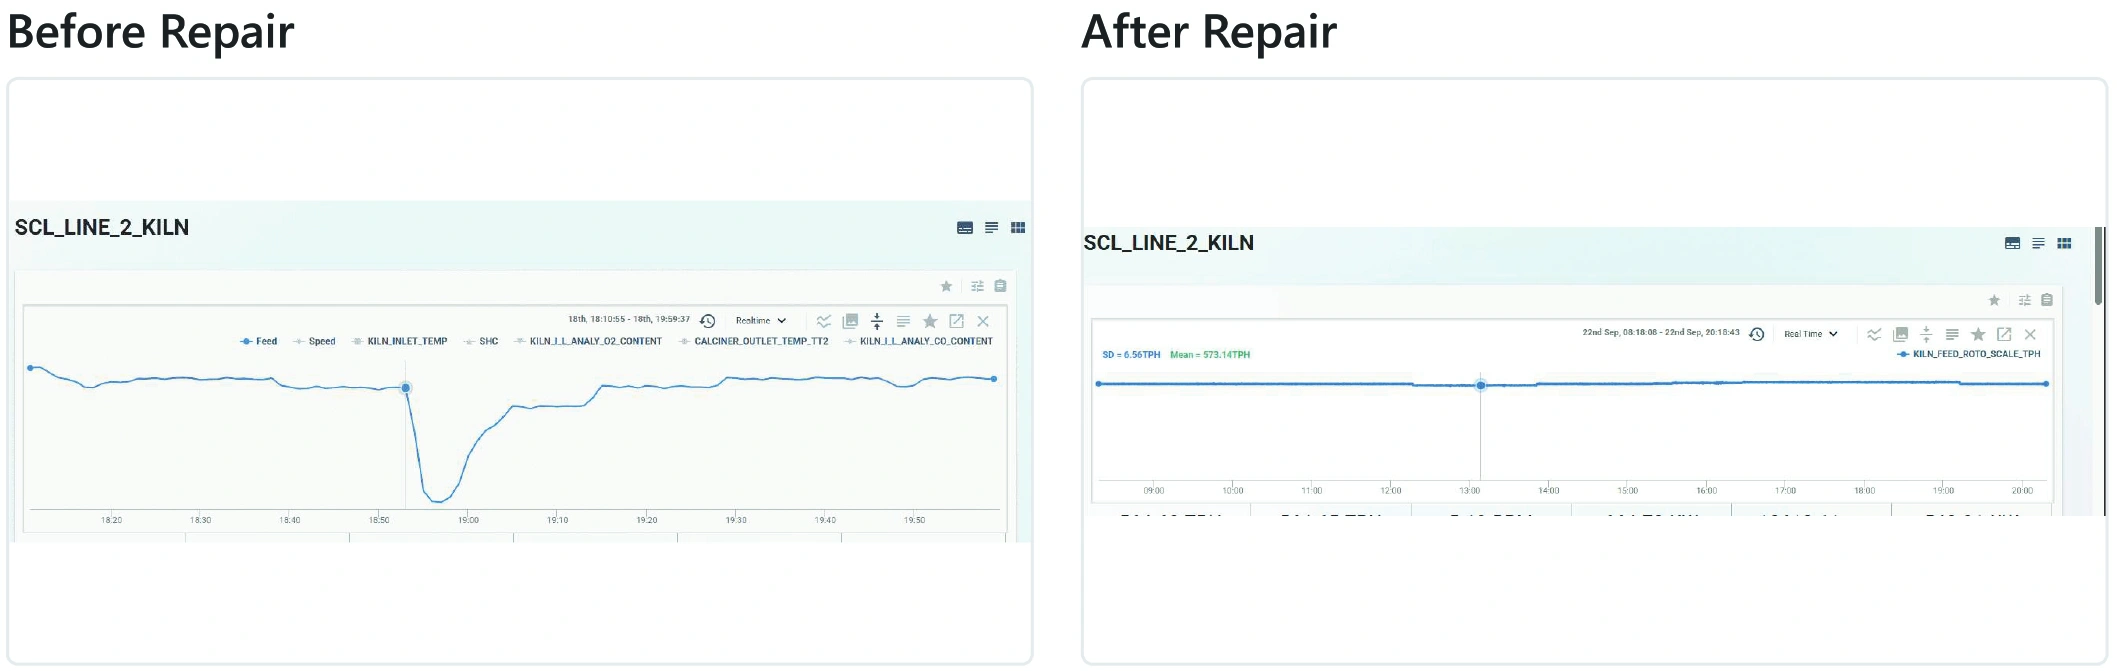
Kiln Feed Throughput (TPH): Before & After Sensor RepairBusiness Impact: 50 tons of production recovered. 5,000 kCal specific heat preserved. Fan
restarted within hours, no recurrence.
Process-Induced Faults in Cement Rotary Kilns 03
The rotary kiln burns preheated raw meal at 1,450°C to form clinker—the irreplaceable intermediate product of
cement. The kiln hood at the feed end must maintain negative draft (-3 to -10 mmWC) for safe combustion. When
process parameters—feed rate, draft balance, coating build-up—destabilize this equilibrium, the consequences
cascade rapidly across the entire production line.
Common process fault modes:
- Feed/moisture imbalance overloading rollers and spiking bearing temps.
- Shell overheat (>350°C) from refractory gaps or flame impingement.
- Coating build-up at kiln inlet and down-comers restricting airflow.
- Fan/damper faults causing positive hood draft and reversed gas flow.
- Calciner instability from coal firing fluctuations driven by draft swings.
Live Incident: Kiln Hood Draft Reversal
Kiln feed dropped twice in quick succession—from 561 TPH to 501 TPH and from 571 TPH to 501 TPH.
Simultaneously, kiln hood draft flipped positive: from -3 mmWC to +12 mmWC. Positive hood pressure risks
combustion gas blowback and flame instability. The cascade unfolded as follows:
- Calciner disruption: coal firing fluctuated; outlet and inlet temperatures destabilized.
- RABH (Raw Meal Auxiliary Bag House) inlet draft blocked, compounding airflow restriction.
- Sustained shortfall: 60–70 TPH for multiple hours; full stoppage risk active.
Root cause (99% Trust Loop diagnosis):Material build-up at the TA Duct (Tertiary Air Duct) take-off caused a sudden release, spiking hood pressure
positive. Coating at the kiln inlet and down-comer, combined with damper imbalance, restricted compensating
airflow.
Verified actions and outcome:
- Installed blasters at TA Duct take-off to clear material accumulation.
- Added two new pressure transmitters at kiln hood for continuous draft monitoring.
- Established threshold: maintain hood draft <–3 mmWC; quarterly transmitter calibration.
- Post-fix: draft stabilized negative; feed restored to 560+ TPH; pre-fix pressure spikes absent in subsequent monitoring.
Kiln Hood Draft (mmWC): Before & After Intervention
Business Impact: 500–750 tons of production preserved. 10–15 hours of potential breakdown
prevented. Kiln stability restored and instrumented.
PlantOS™ and the 99% Trust Loop™: What COOs, CFOs, and CDOs Need to
Know
Cement plants don’t fail from a single catastrophic event—they bleed reliability, throughput, and energy margin
from fault families that conventional systems miss until they’re already costing money. PlantOS™ interrupts this
by detecting anomalies across the full production line and delivering prescriptions that are specific, sequenced,
and closed-loop verified.
| COO | Guaranteed plant uptime and capex discipline. Surprise trips become a managed exception, not a recurring cost. TPH targets are protected by prescriptions, not prayers. |
| CFO | 6–12 month payback vs. the 18–24 month industry norm. Star Cement India reached 10x ROI in under six months. Every prescription carries a financial outcome that is tracked and reported—not estimated after the fact. |
| CDO | Digitally verifiable AI outcomes—not black-box predictions. The 99% Trust Loop™ closes prediction-to-action-to-validation in one platform, integrating with PLC, DCS, SCADA, historian, SAP, and MES. 99.97% prediction accuracy. 99%+ prescription adoption rate. Outcomes the board can audit. |
Powered by the 99% Trust Loop™, every alert delivers three verifiable outcomes in a single prescription:
Reliability (zero surprise trips), Throughput (stable TPH, more clinker), and Efficiency (lower SHC, kWh/ton).
Fault chaos → predictable production wins.
Frequently Asked Questions
1. How is PlantOS™ different from traditional condition monitoring or predictive maintenance?
Most tools stop at trend charts or generic alarms, leaving interpretation to already stretched engineers. PlantOS™
combines high-fidelity sensing with industry-specific prescriptive AI and the 99% Trust Loop™, so teams receive
clear, asset- and process-level prescriptions—what to do, where, and why—and then close the loop by confirming
whether those actions resolved the fault. The outcome is validated, not inferred.
2. What ROI can a cement plant expect, and on what timeline?
Global deployments average <=6-month payback—significantly ahead of the 18–24 months typical of industrial
digital projects. In cement, plants have translated early fault detection into avoided outages, 10–20% recovered
throughput, and up to 2% energy reduction per ton. Star Cement reached 10x ROI in under six months.
3. What data and systems does PlantOS™ integrate with?
PlantOS™ functions as a plant orchestration layer, ingesting data from edge sensors, existing vibration/condition
monitoring systems, PLC, DCS, SCADA, historian databases, SAP, and MES. This enables multi-asset, multi-
parameter views across VRMs, preheaters, kilns, coolers, and finish mills—so reliability and energy decisions are
made in full process context, not asset-by-asset silos.
4. How does the 99% Trust Loop™ reduce false alarms and build leadership confidence?
The loop closes the gap between prediction and action: PlantOS™ predicts and prescribes, operators execute,
and outcomes are formally validated inside the platform. Over time, this filters noise, improves models using real
field feedback, and achieves 99%+ prescription adoption and up to 99.97% prediction accuracy. When PlantOS™
calls a fault, leadership knows it is both real and actionable—not a noise event.
5. Is PlantOS™ limited to rotating equipment, or does it cover process and energy?
PlantOS™ covers the full cement production line: rotating assets (VRMs, fans, mills), process stability (preheater
draft, kiln hood pressure, cooler performance), and energy performance (SHC, kWh/ton KPI tracking). One
platform. Three outcome classes. No parallel initiatives.
See the outcomes for yourself.
Read the world’s most user-validated prescriptive AI case studies—including Star Cement’s 10x ROI in under six months—to explore how 137 cement plants drive Reliability, Throughput, and Efficiency in 1 prescription, with 0 guesswork.
Thank you for your interest in PlantOS™ Prescriptive AI.
Enter your official work email to unlock the World’s Most User-Validated Case Study.[contact-form-7 id=”93f3a5d” title=”pdf downlaod-blog-Plant Reliability Beyond Mechanical Faults”]
Read More on Industrial Reliability

The Four Pillars of Industrial Reliability
In heavy industries today, reliability is no longer just “fewer…

Understanding Types of Vibration and Measurement in Predictive Maintenance
Understanding Types of Vibration and Measurement in Predictive Maintenance What…

Understanding Digital Reliability
Manufacturing industries manage complex production environments where even a single…